Malware of the Day – Command and Control via Google Workspace APIs
What is Malware of the Day?
Lab Setup
Malware: GC2 (Google Command and Control)
MITRE Tactics: TA0011 Command and Control, T1102.002 Application Layer Protocol: Web Service – Bidirectional Communication
Traffic Type: HTTPS/TLS
Connection Type: TCP
C2 Platform: GC2 (Google Command and Control)
Origin of Sample: Active Countermeasures Threat Hunting Lab
Host Payload Delivery Method: EXE binary (C2 agent)
Target Host/Victim: 192.168.2.88 (Windows 10 Enterprise x64)
C2 Infrastructure: Google Sheets API (command dispatch), Google Drive API (data exfiltration), Google OAuth API (agent authentication)
Beacon Timing: None (Long Connection)
Malware of the Day Mission
To identify and share examples of post-compromise network activity in order to better detect and respond to potential network threats. Specifically we are looking for Command and Control (C2) communication channels used by attackers to obtain intelligence, issue commands, and exfiltrate data through a compromised host or hosts.
Background
The Paradox of Trusted Services
Modern enterprise security architecture relies heavily on implicit trust. Organizations whitelist entire domains, grant broad network access, and configure security tools to minimize friction with essential cloud services.
Among the most universally trusted services are those provided by Google Workspace – Gmail, Drive, Sheets, Calendar, and their associated APIs. For organizations that use Google Workspace, these services are typically universally whitelisted. Scrutinizing the deluge of interactions would require considerable security resources, which can often be better invested on other targets.
This implicit trust creates a significant blind spot. When security monitoring tools observe HTTPS connections to google.com or googleapis.com, they assume benign intent. Traditional network security controls – firewall rules, proxy categorization, DNS filtering – all treat Google’s infrastructure as inherently safe. After all, blocking Google would cripple most modern organizations.
Threat actors have recognized this asymmetry. If Google services are trusted by default, and if those services provide programmatic APIs with rich functionality, why not repurpose them as command-and-control infrastructure? The result is a category of malware that weaponizes legitimate cloud services, hiding in plain sight among billions of legitimate API calls.
APT41’s TOUGHPROGRESS: Google Calendar as C2
In May 2025, Google’s Threat Intelligence Group (GTIG) disclosed a sophisticated campaign by the Chinese state-sponsored threat actor APT41 (also tracked as Brass Typhoon, Bronze Atlas, and Winnti). The group had been observed using a malware family called TOUGHPROGRESS that leveraged Google Calendar for command-and-control operations.
TOUGHPROGRESS represented an evolution in cloud-based C2 techniques. The malware was hosted on a compromised government website and used to target multiple other government entities. Once installed, TOUGHPROGRESS would create or monitor calendar events that contained encoded commands. The compromised endpoint would authenticate to Google Calendar via legitimate APIs, retrieve these calendar events, decode the embedded commands, and execute them locally. Results and exfiltrated data were then stored in Google Drive.
Google’s Patrick Whitsell noted: “Misuse of cloud services for C2 is a technique that many threat actors leverage in order to blend in with legitimate activity.” The TOUGHPROGRESS campaign perfectly illustrated this principle – from a superficial network perspective, the malware’s traffic used the same protocols, encryption, and trusted Google domains as legitimate users. This makes it, on surface level at least, hard to detect.
However, the behavioral metadata – connection frequency, timing regularity, and data flow patterns – created detectable anomalies that distinguish automated C2 from genuine human interaction with Google Calendar and Drive. And therein, as is so often the case, lies our opportunity for detection as threat hunters.
The Broader Trend: Weaponizing Google Workspace APIs
APT41’s use of Google Calendar is part of a broader trend of threat actors abusing Google Workspace services for command and control. The underlying technique – leveraging trusted cloud APIs for malicious communications – has been implemented in various forms across the threat landscape.
In 2023, security researchers documented APT41’s use of a tool called GC2 in campaigns targeting a Taiwanese media company. GC2 is an open-source red team framework that uses Google Sheets for command dispatch and Google Drive for data exfiltration.
The GC2 approach is conceptually similar to TOUGHPROGRESS but uses Google Sheets instead of Calendar. An attacker sets up a Google account, creates a spreadsheet to serve as the command queue, and configures a folder in Drive for receiving exfiltrated data. The agent authenticates via OAuth (often using a legitimate-looking service account or compromised credentials), polls the spreadsheet at regular intervals for new commands, and uploads results to Drive.
Note that other variants have been observed using different Google services:
- Google Drive alone: Commands stored as specially-named files, results uploaded as documents
- Gmail: Commands sent via draft emails, a technique previously seen with other APT groups
- Google Forms: Commands embedded in form responses
- Google Docs: Commands hidden in document comments or revision history
All of these techniques share the same fundamental advantage: they leverage Google’s trusted infrastructure, use legitimate APIs with OAuth authentication, and generate traffic that is indistinguishable from normal business operations.
Why This Technique Is Effective
The abuse of Google Workspace APIs for C2 offers attackers several strategic advantages.
Universal Whitelisting: Google domains are whitelisted in virtually every corporate environment. Firewall rules allow outbound HTTPS to *.google.com and *.googleapis.com without inspection. DNS filtering services categorize these domains as “Productivity” or “Business,” ensuring they are never blocked.
Encrypted by Default: All communication is encrypted by default, typically occurring over TLS 1.3, thereby preventing traditional deep packet inspection from examining the content. Security appliances see only encrypted traffic to a trusted destination.
Legitimate Authentication: The agent authenticates using standard OAuth 2.0 flows, which are ubiquitous in modern applications. OAuth tokens are rotated regularly, making static credential detection difficult. The authentication process itself looks identical to a user authorizing a third-party application.
Blends with Legitimate Traffic: Traffic to Google Workspace domains typically blends in with a torrent of legitimate traffic. In most enterprises, hundreds or thousands of employees access Google services throughout the day. The attacker’s C2 traffic blends seamlessly into this noise. Behavioral anomalies are difficult to spot without baseline analysis.
No Infrastructure Maintenance: Leveraging existing Google infrastructure relieves threat actors from this duty, which often represents a major headache. The attacker doesn’t need to maintain servers, register domains, obtain SSL certificates, or worry about infrastructure takedowns. Google provides a reliable, high-availability platform free of charge.
Generous Rate Limits: Since Google Workspace is such a popular platform that is often automated, the default API rate limits are incredibly generous. An agent polling every 30 seconds or so will never trigger quota restrictions since it seems completely normal.
Scenario
In today’s scenario, a threat actor successfully compromised a workstation (192.168.2.88) belonging to an employee named Tresa through a targeted spear-phishing campaign. The initial vector was a malicious document attached to an email that appeared to be from the company’s HR department regarding updated benefits information. When Tresa opened the document and enabled macros – a common social engineering tactic – the embedded macro executed PowerShell commands that downloaded and installed a GC2 agent from a staging server.
The GC2 agent, disguised as a file named “chromeupdater.exe” to blend in with legitimate Google Chrome update processes, was written to the C:\Users\tresa\AppData\Local\Temp directory. Upon execution, the malware immediately reached out to authenticate against Google’s OAuth API infrastructure. The attacker had pre-configured OAuth credentials for a Google Workspace account under their control.
Following successful authentication, the agent began its C2 operations. The attacker had set up a Google Sheet titled “System Metrics Q4” – again, a deliberately mundane name that wouldn’t raise red flags if spotted. This spreadsheet served as the command queue, with a simple structure: Column A contained commands to be executed, Column B stored execution results, while Column C contained the timestamp of execution.
The agent established a long-lived HTTPS connection to sheets.googleapis.com and began polling the spreadsheet at regular intervals. Though polling (that is to say client requests) took place approximately every 30 seconds, the connection itself remained open for an entire hour before disconnecting, and immediately reconnecting.
Throughout the initial reconnaissance phase, the attacker issued a series of commands typical of post-exploitation enumeration: netstat -ano to identify active network connections, tasklist to enumerate running processes, net localgroup administrators to identify privileged accounts, systeminfo to understand patch levels and potential vulnerabilities, and ipconfig to map the internal network topology.
For data exfiltration, the attacker leveraged a second Google API endpoint: www.googleapis.com, which provides access to Google Drive functionality. The agent uploaded collected data – screenshots, credential files, browser history, and enumeration results – to a dedicated folder in the attacker’s Google Drive account. This resulted in approximately 253 MB of data being transferred out of the network, all appearing as legitimate Google Drive traffic to perimeter security controls.
The compromise went undetected for over 24 hours, during which the attacker maintained persistent access, gathered sensitive information, and positioned themselves for the next phase of the attack – likely lateral movement to additional high-value targets within the network. Our investigation began when a diligent network analyst, conducting routine behavioral threat hunting with RITA, noticed anomalous patterns in connections from 192.168.2.88.
Network Behavioral Analysis with RITA
Our investigation began, as it often does, with routine analysis of network logs in RITA. Examining the previous 24 hours of Zeek data, a pair of related connections immediately stood out – see Images 1 and 2 below.
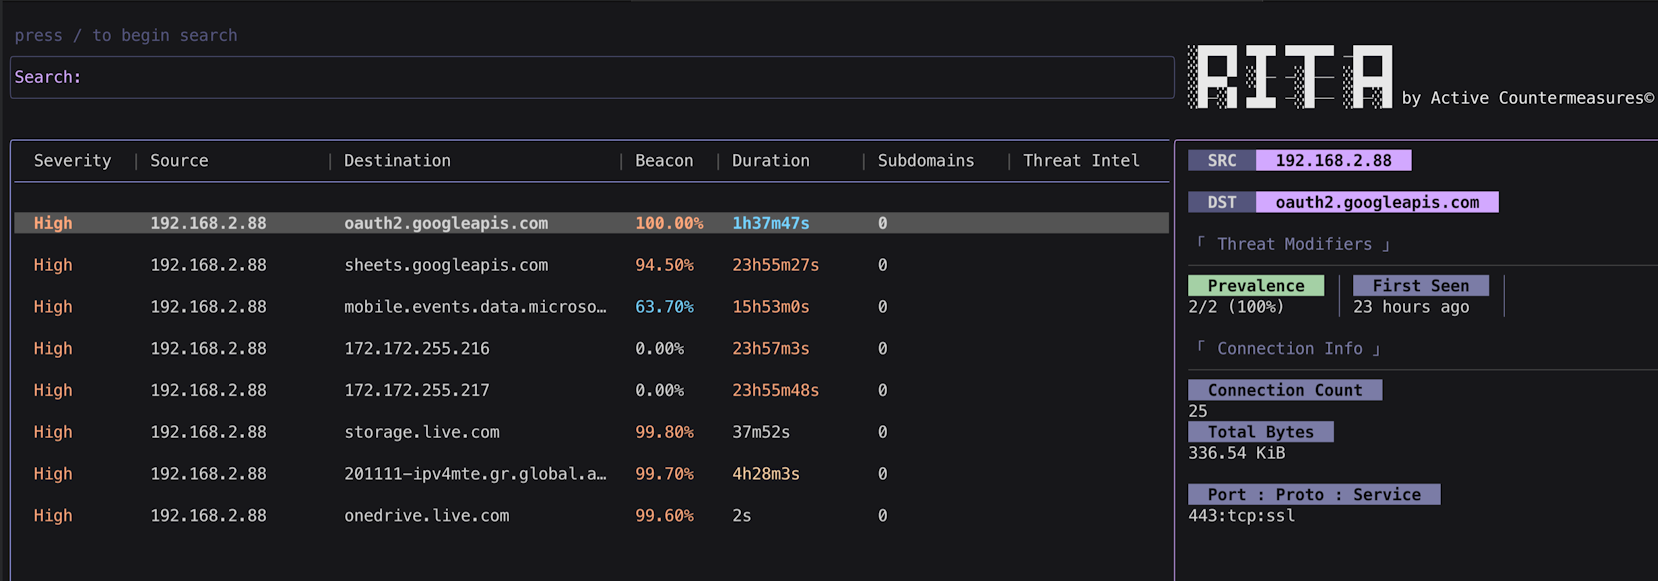
Image 1. RITA identifies a connection to oauth2.googleapis.com with 100% beacon score and 25 connections over 24 hours.
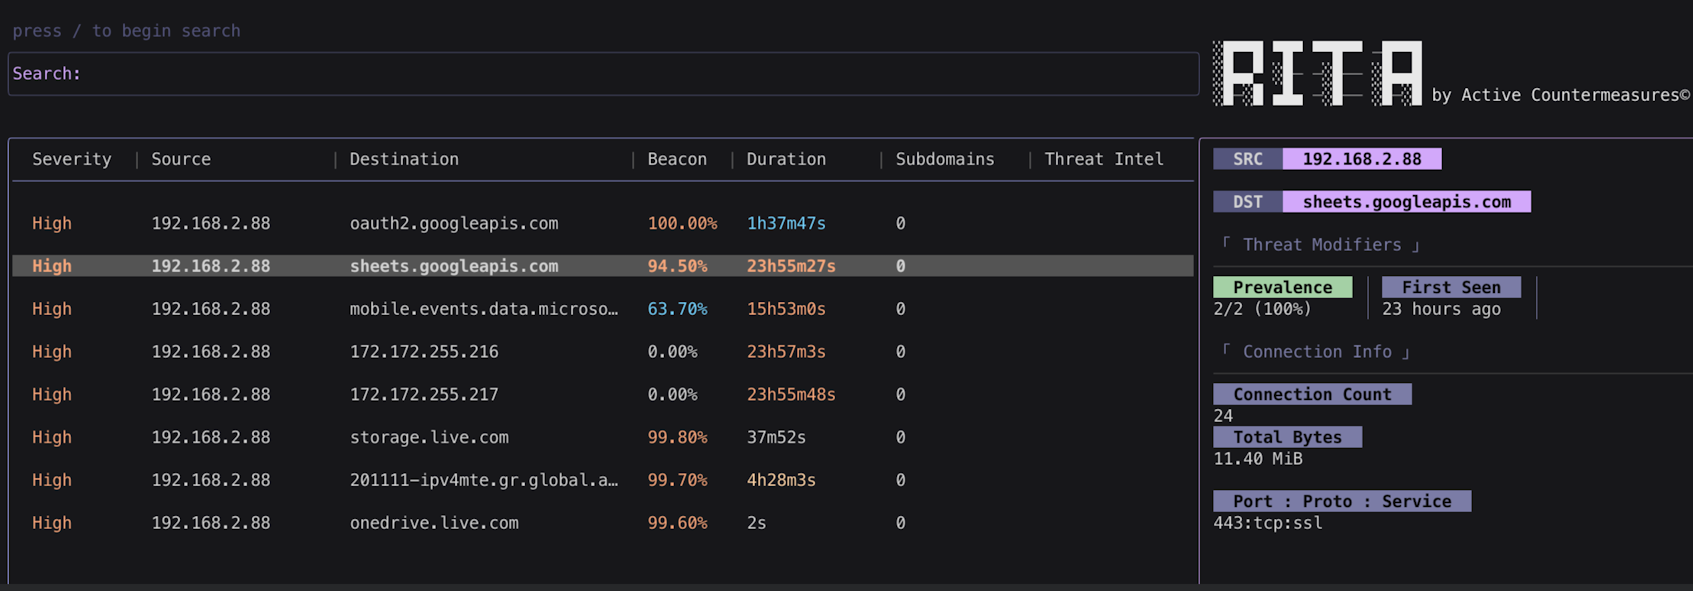
Image 2. RITA identifies a second connection to sheets.googleapis.com with 94.50% beacon score, extremely high duration (23h 55m 27s), and 11.40 MB transferred.
Though these connections were to oauth2.googleapis.com and sheets.googleapis.com – both trusted Google infrastructure – several characteristics stood out as unusual and warranted further investigation.
Both connections occurred over HTTPS on port 443, which is entirely expected and normal. However, despite relatively low connection counts (25 to oauth2.googleapis.com and 24 to sheets.googleapis.com), both exhibited remarkably high beacon scores: 100% for oauth2.googleapis.com and 94.50% for sheets.googleapis.com. In RITA, a beacon score represents the regularity and consistency of connection timing – higher scores indicate automated, periodic communication rather than human-driven, ad-hoc access patterns.
The connection to sheets.googleapis.com was particularly noteworthy. It maintained a cumulative duration of 23 hours, 55 minutes, and 27 seconds – essentially the entire 24-hour investigation period. While long-lived connections to Google services aren’t inherently suspicious (many legitimate applications maintain persistent connections), this extreme duration combined with the high beacon score suggested automated rather than interactive behavior.
Additionally, 11.40 MB was transferred between the local host and the Sheets API. While not a massive amount by modern standards, this volume is somewhat unusual for typical Google Sheets usage, which primarily involves small text-based updates and rarely transfers multiple megabytes of data in a single day.
At this point, there was nothing to set off immediate alarm bells – Google Workspace connections with some automated characteristics could easily have legitimate explanations: integration scripts, scheduled reporting tools, or third-party applications using Google APIs. However, the combination of perfect beacon regularity, extreme connection duration, and non-trivial data transfer certainly warranted deeper investigation.
Network Behavioral Analysis with AC-Hunter 7
We can now turn to AC-Hunter to examine these same connections with greater visual detail and timing precision. AC-Hunter’s graphical representations often reveal patterns that are difficult to discern from raw numerical scores alone.
We first examined the connection to oauth2.googleapis.com. The hourly-connection graph immediately revealed remarkable consistency – see Image 3.
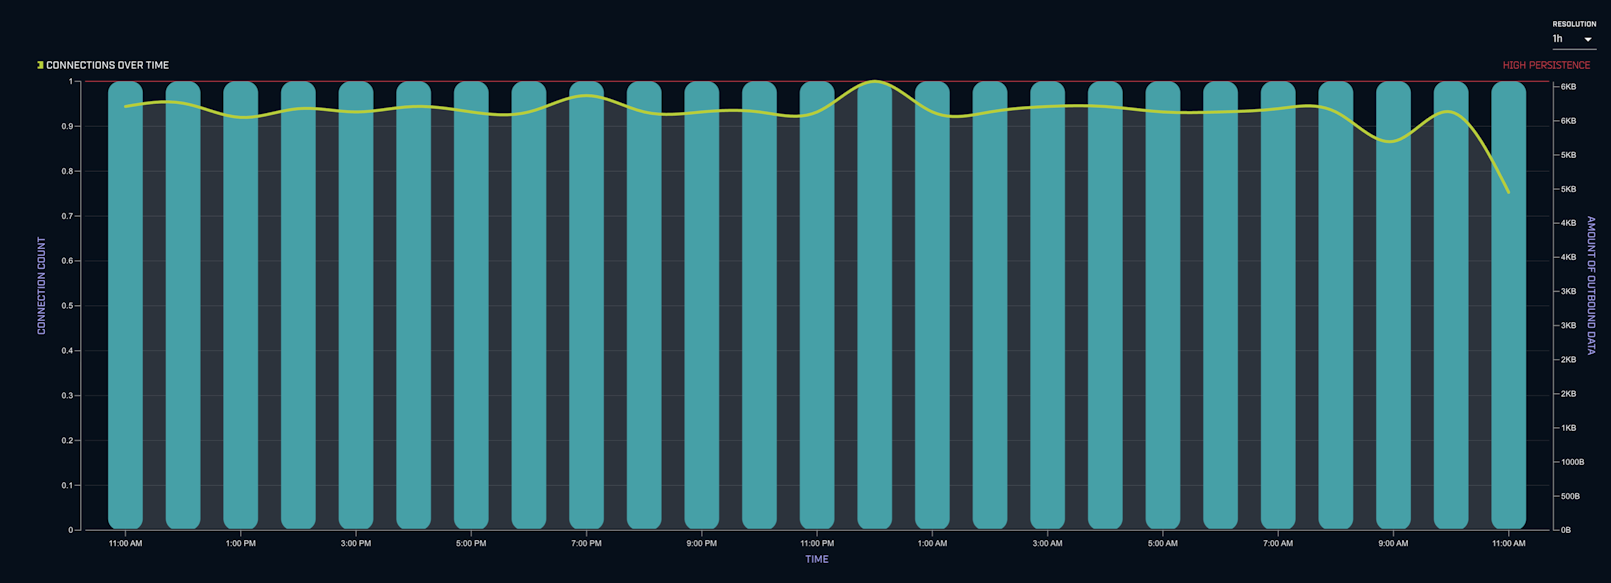
Image 3. AC-Hunter’s hourly-connection graph for oauth2.googleapis.com shows exactly one connection per hour, every hour, for the entire 24-hour investigation period – a pattern consistent with automated, scheduled behavior rather than human interaction.
Despite the relatively low total connection count, there was precisely one connection per hour, for every hour in the investigated period. This level of consistency is extremely rare in human-driven behavior. Legitimate users don’t access OAuth endpoints with clockwork precision – they authenticate when needed, with natural variability based on work patterns, meetings, breaks, and other human factors.
This hourly pattern is further reinforced when we examine AC-Hunter’s Connection Dispersion Histogram – see Image 4.
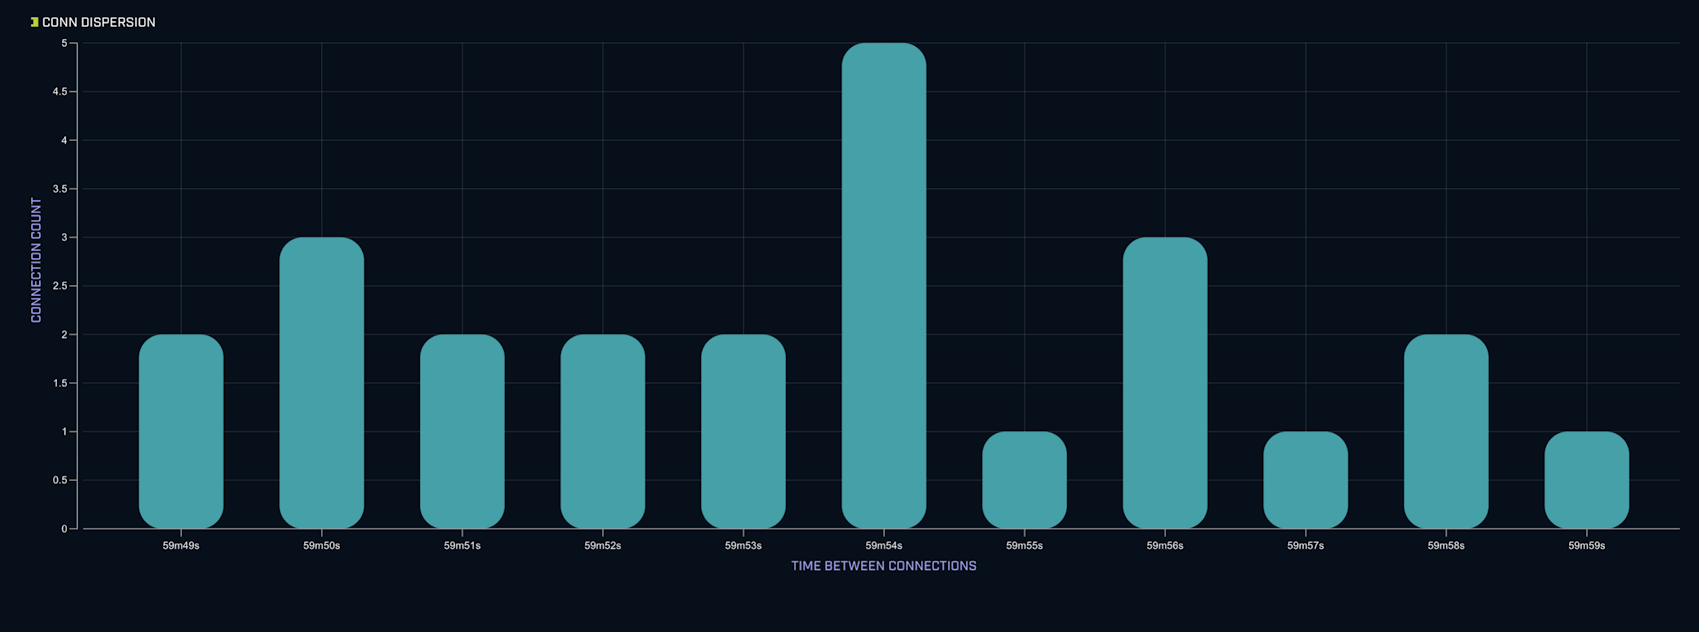
Image 4. The Connection Dispersion Histogram for oauth2.googleapis.com shows all connections clustered at near-identical intervals, with very little deviation – the hallmark of automated beaconing behavior.
The histogram displays a single, tight cluster representing the interval between connections. There’s very little spread, representing a remarkably consistent interval between each OAuth API call.
It’s also worth noting that AC-Hunter provides us with the SNI (Server Name Indication) IPs – the resolved IP addresses for the domain – see Image 5. This information may prove valuable when we pivot to Zeek logs, so for now we simply note them down.
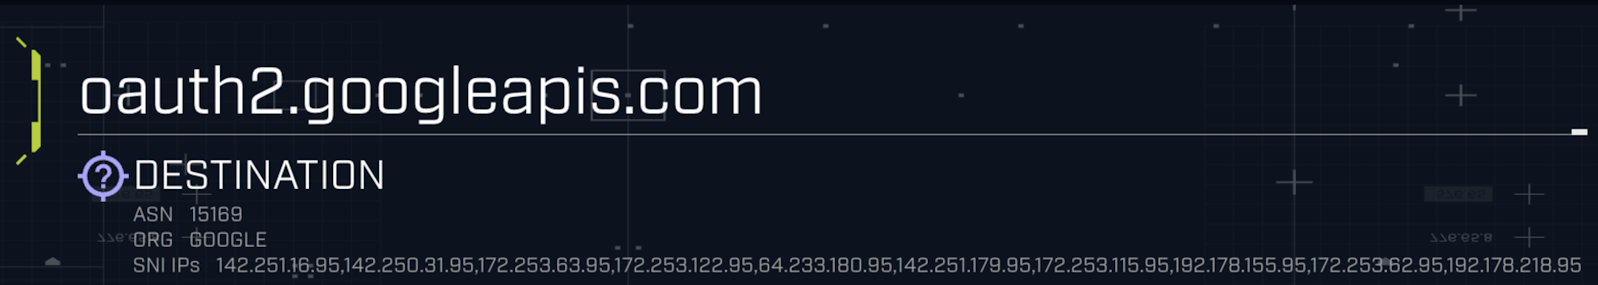
Image 5. AC-Hunter displays the SNI IPs for oauth2.googleapis.com, showing the exact IP addresses resolved during these connections.
Examining the connection to sheets.googleapis.com revealed remarkably similar patterns. Once again, the Hourly-Connection Graph showed exactly one connection per hour, every hour – see Image 6.
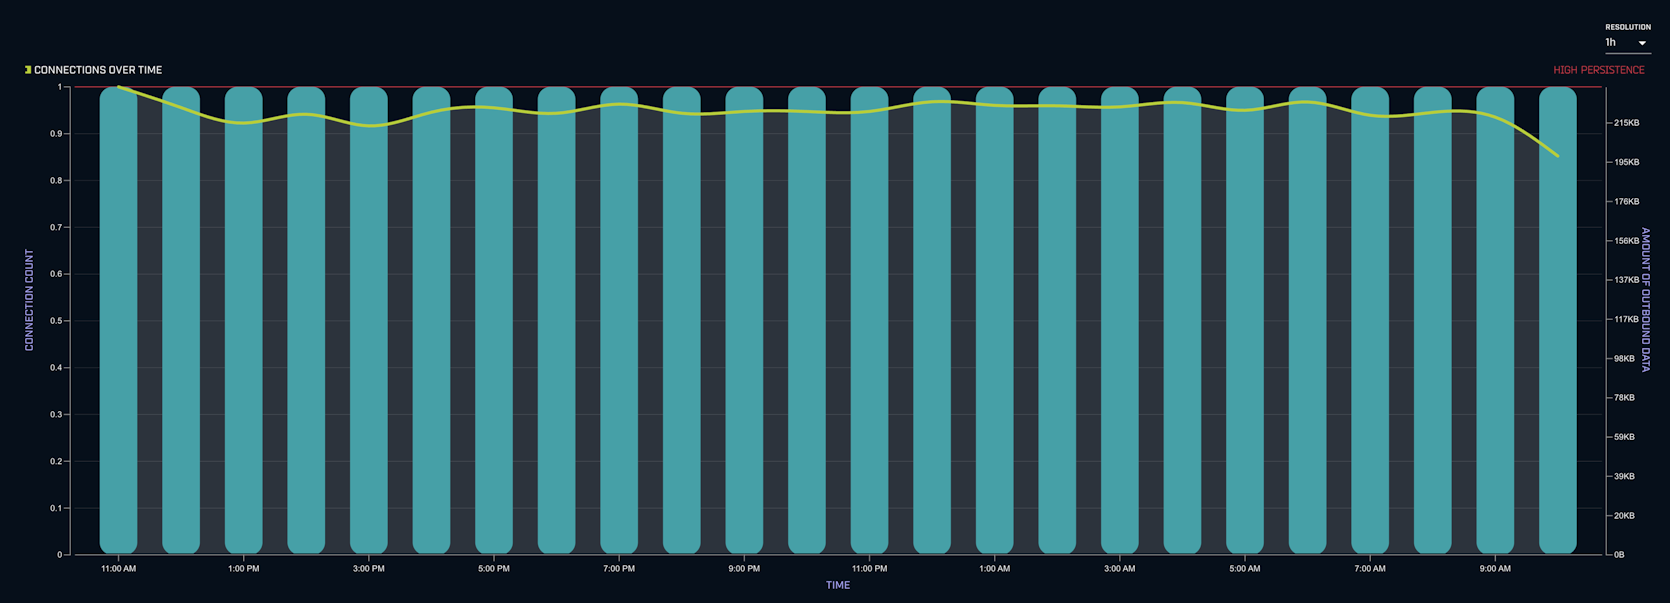
Image 6. The hourly-connection graph and Connection Dispersion Histogram for sheets.googleapis.com mirror the oauth2 patterns – perfect hourly consistency with zero temporal variance.
This correlation between the OAuth and Sheets connections is significant. The fact that both exhibit identical timing patterns suggests they’re part of the same operational process. This coordinated timing is characteristic of C2 frameworks that implement token refresh and command polling in a single operational loop.
Both AC-Hunter and RITA have proven remarkably valuable in providing initial suspicion that, though communication targets a trusted domain, the underlying behavior appears automated and potentially suspicious. RITA first gave us clear quantitative indicators through beacon scores and duration metrics. Now, AC-Hunter’s visual representations have provided greater insight and depth into the mechanical regularity of the communication patterns.
This regularity is especially telling given organizational context. Employees are only in the office between 9 AM and 6 PM, and we would not expect any Google Sheets activity – particularly activity with this level of consistency – occurring at 2 AM, 4 AM, and throughout the night. Legitimate business users simply don’t interact with spreadsheets with machine-like precision at all hours.
Now, this is no “smoking gun” by any stretch of the imagination. There are numerous legitimate reasons for automated, regular connections to Google APIs: integration platforms, monitoring tools, scheduled report generators, and various business automation solutions. However, taking everything into consideration – the perfect timing regularity, the 24-hour persistence, the non-trivial data transfer, and the lack of correlation with business hours – we certainly should investigate further.
At this point, we proceed down two avenues. First, we want to examine source logs in Zeek to see if there are additional details that might provide further evidence or context. Thereafter, given that the targets are universally trusted domains where behavioral anomalies alone may not be conclusive, we would certainly need to examine the process responsible for these connections – meaning we’ll turn to Sysmon for endpoint-level investigation.
Deeper Traffic Analysis with Zeek
The first step in our Zeek analysis is to ensure we haven’t missed any related connections. RITA and AC-Hunter surface high-confidence anomalies, but they apply filtering and scoring logic that might bury lower-volume or lower-scoring connections that could still be part of the same campaign. We can query Zeek’s dns.log directly to see all Google API queries from this host.
We run the following command:
cat dns.log | zeek-cut query | grep "googleapis.com" | sort | uniq -c
This command extracts only the query field from dns.log using zeek-cut, filters for queries containing “googleapis.com” using grep, then sorts and counts unique entries with sort and uniq -c. This gives us a comprehensive view of all Google API domains queried by this host – see Image 7.
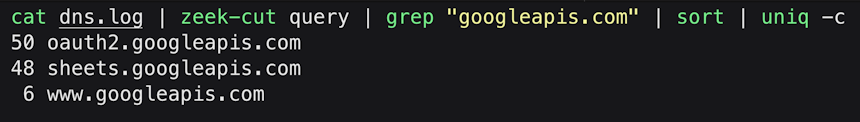
Image 7. DNS query results reveal three distinct googleapis.com domains: oauth2, sheets, and www – indicating the agent is using multiple Google API services.
In addition to the two domains we already identified, we see a third: www.googleapis.com. This is significant – www.googleapis.com is the primary endpoint for Google Drive API operations. The presence of this domain suggests the agent isn’t just receiving commands via Sheets, but also using Drive for additional operations – most likely data exfiltration.
There are several reasons this connection might not have surfaced in RITA or AC-Hunter. With only 3 connections over 24 hours (remember dns.log logs both the query and response, hence 6 entries for 3 connections), the connection count is quite low and may have fallen below default threshold filters. The beacon score would also be relatively low given the limited sample size.
Alternatively, some organizations configure safe-lists in their analysis platforms to automatically exclude known-benign domains like www.googleapis.com from behavioral analysis, since the overwhelming majority of traffic to these domains is indeed legitimate.
Regardless of why we missed it initially, we now want to characterize these connections: how long did they last, and how much data was transferred? Understanding the volume of data moved to www.googleapis.com could indicate whether this is simply operational C2 communication or active data exfiltration.
To track these connections across different Zeek logs, we’ll use the UID (Unique Identifier) field. Each network session in Zeek is assigned a unique UID that remains consistent across all log files – dns.log, ssl.log, conn.log, http.log, etc.
Think of it like a primary key in a relational database: it allows us to correlate the same connection as it appears in different logs, joining information like “this DNS query” with “this SSL negotiation” with “this data transfer.”
However, we need to be careful here. We don’t want the UIDs from dns.log itself, because those represent the DNS query transactions – the brief UDP exchanges asking “what’s the IP for www.googleapis.com?” What we actually want are the UIDs for the subsequent HTTPS connections that resulted from those DNS resolutions – the actual TCP sessions where data was transferred.
We can pivot to ssl.log, where we can get the UIDs for HTTPS connections using the following command:
cat ssl.log | zeek-cut uid server_name | grep "www.googleapis.com"
Here we’re extracting both the uid and server_name columns from ssl.log. The server_name field corresponds to the SNI (Server Name Indication) value from the TLS handshake, which matches the query field we saw in dns.log. By grepping for “www.googleapis.com”, we now display only those three connections. See results in Image 8.
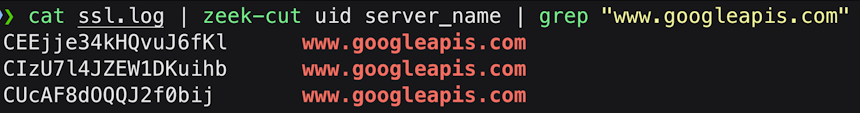
Image 8. SSL log results showing UIDs for the three HTTPS connections to www.googleapis.com.
We now have three UIDs – CEEjje34kHQvuJ6fKl, CIzU7l4JZEW1DKuihb, and CUcAF8dOQQJ2f0bij – which we can query in conn.log. The conn.log contains comprehensive connection metadata, including duration and bytes transferred, which will tell us exactly how long these sessions lasted and how much data moved in each direction.
We can use the following command:
cat conn.log | zeek-cut uid duration orig_bytes resp_bytes | grep -E 'CEEjje34kHQvuJ6fKl|CIzU7l4JZEW1DKuihb|CUcAF8dOQQJ2f0bij'
This command extracts four fields from conn.log: uid (the unique identifier), duration (in seconds), orig_bytes (bytes sent from our host), and resp_bytes (bytes received by our host). The grep -E flag enables extended regex, allowing us to search for multiple UID patterns separated by the pipe (|) operator. See the results in Image 9.

Image 9. Raw conn.log output showing duration in seconds and byte counts for the three www.googleapis.com connections.
This gives us the data we need, but the format is not user-friendly. The duration is in seconds, the byte counts are in raw bytes, and the three connections are listed separately. What we’d really like is to convert duration to minutes, byte counts to megabytes, and aggregate the totals so we can assess the overall volume of the www.googleapis.com activity.
We could write a simple bash or Python script to perform these calculations, but for quick analysis, we can use awk – a powerful text processing utility built into Unix/Linux systems. The following awk command will aggregate the data and convert units:
cat conn.log | zeek-cut uid duration orig_bytes resp_bytes | grep -E 'CEEjje34kHQvuJ6fKl|CIzU7l4JZEW1DKuihb|CUcAF8dOQQJ2f0bij' | awk '{dur+=$2; sent+=$3; recv+=$4} END {print "Duration: " dur/60 " min\nSent: " sent/1048576 " MB\nReceived: " recv/1048576 " MB\nTotal: " (sent+recv)/1048576 " MB"}'
We can now see our results – see Image 10.
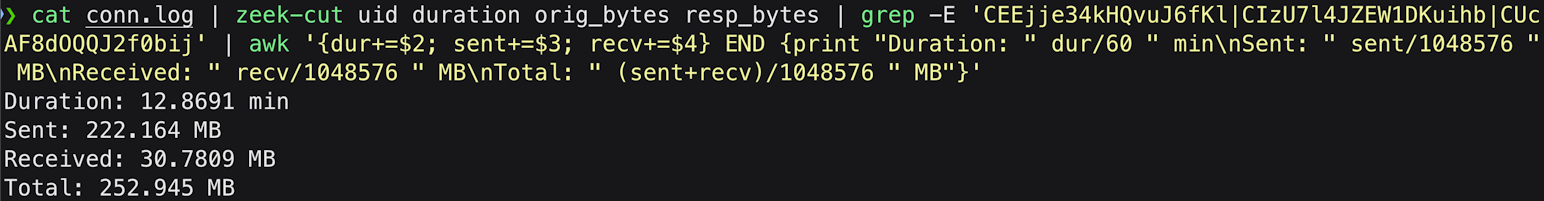
Image 10. Aggregated results show 12.8691 minutes total connection time, with 30.7809 MB sent and 222.164 MB received, totaling 252.945 MB.
The results are striking. The total connection duration for the three www.googleapis.com sessions was just under 13 minutes – relatively brief compared to the 24-hour sheets.googleapis.com connection. However, the data transfer volume tells a clear story: approximately 253 MB total, with 222 MB sent from our host to Google Drive.
This represents bidirectional malicious activity. The 222 MB sent from our compromised host to Google Drive represents data exfiltration – likely including screenshots, credential dumps, browser history, cached files, enumeration results, and other sensitive data the attacker collected during the reconnaissance phase. The 31 MB received from Google Drive may represent the attacker downloading additional payloads, scripts, and tools from their staging area in Drive to the compromised host.
The volume, especially for exfiltration, is significant. While legitimate Google Drive usage certainly occurs in enterprise environments – backup tools, file synchronization services, collaborative document workflows – 222 MB of uploads in three brief sessions (totaling under 13 minutes) is unusual. Most legitimate Drive activity involves smaller, more distributed uploads throughout the workday, not large batch transfers. Combined with our other indicators – the suspicious process, the mechanical timing patterns, the 24-hour persistence – this substantial outbound data flow strongly suggests systematic data exfiltration rather than normal business operations.
The network evidence has now provided us with substantial cause for concern. We have three distinct Google API endpoints being accessed (OAuth, Sheets, Drive), all exhibiting unusual characteristics: mechanical timing regularity, 24-hour persistence, and significant data transfer volumes. However, because all of this activity targets universally trusted Google infrastructure, we cannot definitively conclude malicious intent based on network evidence alone.
In a case such as this, where network evidence gives us plenty to think about but the communications target a legitimate domain, we really need to examine the process responsible for these connections. This is where endpoint telemetry becomes critical.
We can use Sysmon logs for passive endpoint investigation to determine several crucial facts: Which process was responsible for mediating these connections? Is it the process we would expect to be accessing Google APIs? Where is the executable located? What is its command line? What other processes has it spawned? Answering these questions will either confirm our suspicions or provide a benign explanation for the anomalous network behavior.
Endpoint Investigation Using Sysmon
Our first objective is to identify which process initiated the connections to googleapis.com domains. We can query Sysmon Event ID 22 (DNSEvent) to see which processes performed DNS queries for these domains. Let’s use the following PowerShell script – see Image 11.
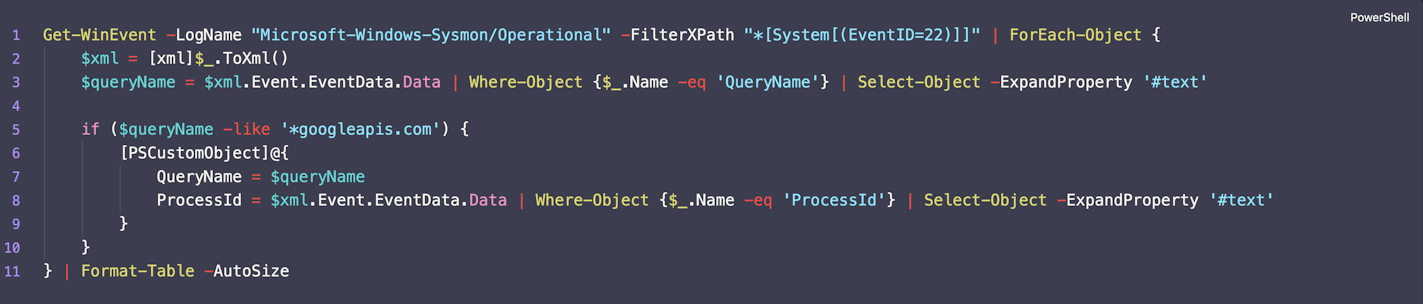
Image 11. PowerShell script querying Sysmon Event ID 22 (DNS queries) for googleapis.com domains and extracting Process IDs.
This script filters through all Sysmon logs for Event ID 22, which logs DNS queries made by processes. Event IDs 3 and 22 are among Sysmon’s most valuable event types for threat hunting, since they provide visibility into which specific processes are initiating network communications – information that network logs alone cannot provide.
When we filter for queries containing “googleapis.com”, we’ll see only DNS resolutions related to Google API endpoints. We’re extracting just the ProcessId for simplicity, since our immediate goal is to identify the process in question. We could extract additional fields like Image (executable path) or User, but starting with just the PID keeps the output clean and focused.
It’s worth briefly noting that Sysmon also provides a field called ProcessGuid – a globally unique identifier that persists across the lifetime of a process and can be used to track that specific process instance even if the PID is reused.
ProcessGuid is particularly valuable in complex investigations involving process injection, parent-child relationships, or tracking processes across long time periods. However, for our current investigation, the PID is sufficient. We’re looking at a single compromised host over a 24-hour period where PID reuse is unlikely to cause confusion, and PID is simpler to work with when cross-referencing other event types.
When we run the script, we get the following results – see Image 12.
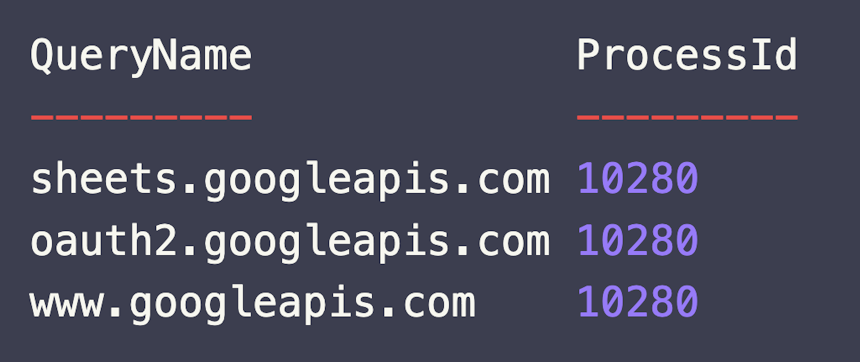
Image 12. Results show all three googleapis.com queries (oauth2, sheets, www) were made by the same process: PID 10280.
We can see that for all three Google API domains – oauth2.googleapis.com, sheets.googleapis.com, and www.googleapis.com – the queries were mediated by the same process with PID 10280.
This confirms what we suspected from the network timing patterns: these aren’t separate, unrelated processes coincidentally accessing Google services. This is a single executable orchestrating all three API interactions as part of a coordinated operation.
Now we need to identify this process. We can query Sysmon Event ID 1 (Process Creation) to get comprehensive information about PID 10280 – see Image 13.

Image 13. PowerShell script querying Sysmon Event ID 1 (Process Creation) for PID 10280 to identify the executable responsible for googleapis.com connections.
Event ID 1 logs process creation events and captures extensive metadata about each new process: the executable path (Image), command line arguments (CommandLine), parent process (ParentImage and ParentCommandLine), user context (User), integrity level, and more. This is arguably the most important Sysmon event type for threat hunting, as it provides visibility into what’s actually executing on the system.
When we run the query, we get our results – see Image 14.
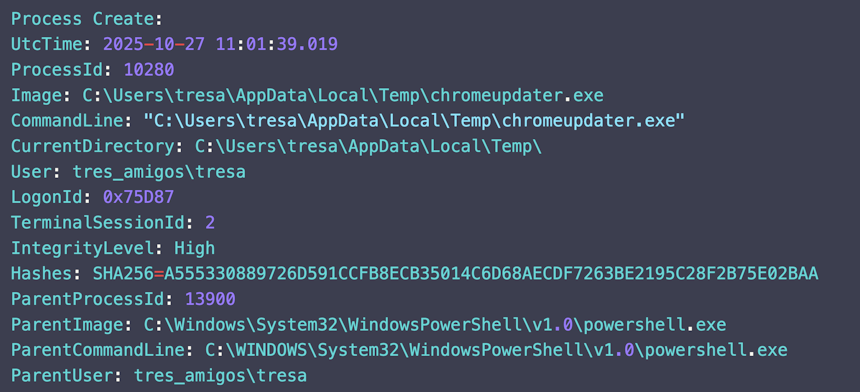
Image 14. Process details reveal the executable responsible for googleapis.com connections: C:\Users\tresa\AppData\Local\Temp\chromeupdater.exe – a suspicious name, location, and parent process (PowerShell).
This is the smoking gun. The process connecting to Google APIs is: C:\Users\tresa\AppData\Local\Temp\chromeupdater.exe
Let’s examine why this is deeply suspicious:
Suspicious Name: While “chromeupdater.exe” tries to masquerade as a legitimate Google Chrome update component, the actual Chrome updater is called GoogleUpdate.exe and is located in C:\Program Files (x86)\Google\Update\ or C:\Users\[user]\AppData\Local\Google\Update\. Legitimate Chrome updater processes would never be named “chromeupdater.exe” – this is a common tactic where attackers choose names that sound plausible to casual observers but don’t match actual system binaries.
Suspicious Location: The executable resides in C:\Users\tresa\AppData\Local\Temp\, which is a temporary directory frequently used by malware. Legitimate installed applications, once properly installed, execute from Program Files, Program Files (x86), or their own AppData\Local subdirectories – not from the Temp folder. The Temp directory is commonly used by malware for several reasons: it typically has relaxed permissions allowing execution, it’s a logical place for malware droppers to write initial payloads, and many users and even some security tools overlook it during routine scans.
Suspicious Parent Process: The Sysmon Event ID 1 data shows this process was spawned by PowerShell (powershell.exe). Legitimate Chrome updater processes are spawned by the Google Update Service or by the user clicking the Chrome installer, not by PowerShell scripts. The PowerShell parent is a strong indicator of malicious execution, as it suggests the process was launched via a script – likely the initial compromise vector (a malicious macro, a phishing attachment, or a staged payload delivery).
Operational Context: We would not expect any Chrome update process to maintain persistent connections to Google Sheets, OAuth, and Drive APIs for 24 hours straight. Chrome’s actual update mechanism is brief and periodic – it checks for updates, downloads if needed, and terminates. It certainly doesn’t maintain day-long connections or access Google Workspace productivity APIs, which are completely unrelated to browser updates.
At this point, we have overwhelming evidence of compromise. However, to build an even more complete picture of the attacker’s activities, let’s take one additional investigative step. We can query Sysmon Event ID 1 again, but this time looking for processes where 10280 was the Parent Process ID (PPID). This will show us what commands chromeupdater.exe spawned – revealing the specific post-exploitation commands the attacker executed on the compromised system.
We can use the following script – see Image 15.
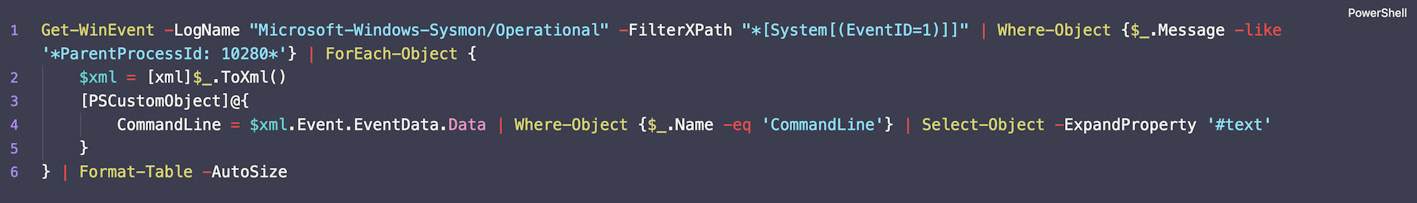
Image 15. PowerShell script querying Sysmon Event ID 1 where ParentProcessId equals 10280, revealing all child processes spawned by chromeupdater.exe.
This query will output a table showing the CommandLine field for every process that was spawned by PID 10280, allowing us to see exactly what commands the malware executed. See results in Image 16.
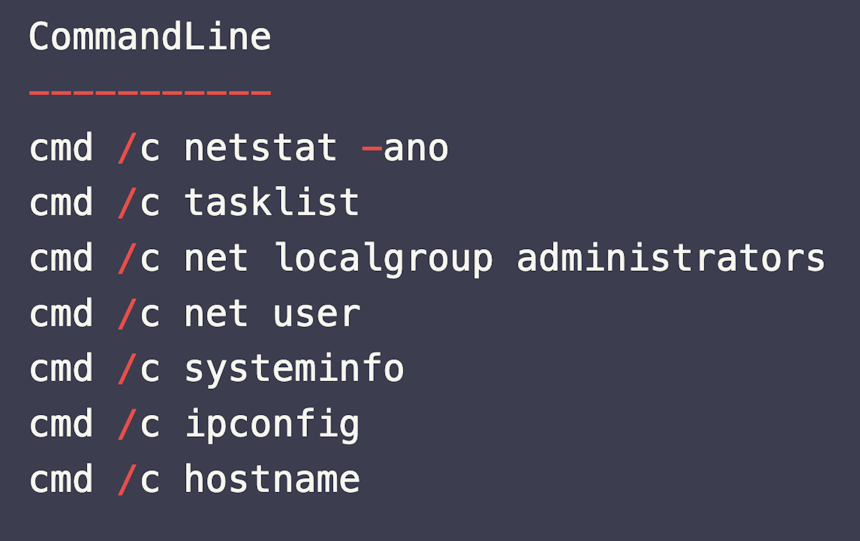
Image 16. Child processes reveal a systematic reconnaissance campaign: network enumeration, process listing, privilege escalation checks, system information gathering, and network topology mapping – classic post-exploitation behavior.
The results confirm systematic post-exploitation reconnaissance. The attacker executed numerous commands that we would absolutely not expect from any legitimate “Chrome updater” process.
This command sequence is textbook post-exploitation reconnaissance – a systematic enumeration of the compromised system’s security posture, network position, privilege level, and potential pivot points. No legitimate Chrome update process would ever execute these commands.
Combined with our network behavioral analysis showing automated, persistent connections to Google Workspace APIs, we now have definitive proof of compromise. The case is conclusive enough to escalate immediately to the Incident Response team with high confidence.
Conclusion
This investigation into a GC2 (Google Command and Control) compromise highlights several critical lessons for threat hunters and network defenders, particularly around the challenge of detecting malicious activity that leverages universally trusted infrastructure.
Trusted Domains, Untrusted Behavior
The most significant challenge presented by this compromise is that every network connection targeted legitimate, trusted Google infrastructure. Traditional signature-based detection would have been completely blind to this activity. The domains were whitelisted, the encryption was legitimate TLS 1.3, and the authentication used standard OAuth 2.0 flows. From a protocol perspective, there was nothing “wrong” with any of the traffic.
This underscores a fundamental shift in modern threat hunting: we can no longer rely primarily on reputation-based controls (blocklists, domain categorization) or signature-based detection (IDS/IPS rules for known-bad indicators). Sophisticated adversaries have moved to a model of “living off the land” – using trusted services, legitimate tools, and native OS binaries to conduct their operations.
The solution is behavioral analysis. Even when adversaries use trusted infrastructure, they leave behavioral fingerprints that betray the presence of automation, regular timing patterns, and usage profiles that deviate from human baselines. RITA and AC-Hunter excel precisely in this domain – they don’t ask “is this domain bad?” but rather “does this connection behave suspiciously?”
The Power of Behavioral Analysis
Despite targeting one of the world’s most trusted cloud platforms, the GC2 agent exhibited clear behavioral anomalies that made detection possible. The perfect hourly timing consistency, the 24-hour connection persistence, the mechanical regularity visible in AC-Hunter’s connection histograms – these patterns were detectably different from legitimate human interaction with Google Workspace.
RITA’s beacon scoring algorithm, which analyzes connection interval consistency, connection count, and duration, immediately flagged these connections with high confidence scores despite the trusted destination. AC-Hunter’s visual representations then provided the depth and context necessary to understand that we were looking at automated, machine-driven behavior rather than human productivity tool usage.
This demonstrates why behavioral analysis tools are not just nice-to-have additions to a security stack – they’re essential components of modern defense. As adversaries increasingly migrate to trusted infrastructure, behavioral detection becomes one of the few reliable methods for identifying compromise.
Network Context Alone Isn’t Enough
While RITA and AC-Hunter provided critical initial detection, network behavioral analysis alone could not definitively confirm malicious intent. The connections, while suspicious, could theoretically have legitimate explanations: integration platforms, API-based automation tools, scheduled reporting systems, or third-party applications leveraging Google Workspace APIs for legitimate business purposes.
The definitive confirmation came from endpoint telemetry. Sysmon Event ID 22 (DNS queries) allowed us to identify which process was responsible for the connections. Sysmon Event ID 1 (Process Creation) revealed that this process was a suspicious executable with a masqueraded name, running from a temporary directory, spawned by PowerShell. Finally, examining child processes spawned by the malware exposed systematic reconnaissance commands that left no doubt about malicious intent.
This investigation demonstrates why a layered defense approach is mandatory. Network behavioral analysis (RITA/AC-Hunter) provides the initial detection and hypothesis generation. Deep packet analysis (Zeek) provides connection context and data flow characterization. Endpoint telemetry (Sysmon) provides process attribution and command-level visibility. Only by correlating data from all three layers can we build an irrefutable case and understand the full scope of adversary operations.
Recommendations for Defenders
Based on this investigation, we recommend the following for organizations seeking to improve their detection capabilities against sophisticated C2 frameworks that leverage trusted cloud services:
- Implement behavioral analysis as a core detection strategy: Deploy tools like RITA and AC-Hunter that can identify automated patterns, beaconing behaviors, and long connections regardless of destination reputation. These tools are specifically designed to detect C2 channels that bypass traditional controls.
- Deploy comprehensive endpoint telemetry: Install Sysmon with a robust configuration that captures, at minimum, Event IDs 1 (Process Creation), 3 (Network Connection), 7 (Image Loaded), 22 (DNS Query), and 11 (File Creation). Ensure these logs are centralized in a SIEM or log aggregation platform where they can be queried and correlated with network data.
- Establish and monitor behavioral baselines: Know what normal Google Workspace usage looks like in your organization. Which users access which APIs? At what times? With what frequency? Deviations from these baselines become detectable only when baselines exist. Consider implementing user and entity behavior analytics (UEBA) solutions that can automatically identify anomalous access patterns.
- Investigate trusted connections holistically: Don’t dismiss connections to Google, Microsoft, or other major cloud providers as automatically benign. Scrutinize connection patterns, timing regularity, data volumes, and – critically – the process context. A connection to a trusted domain is only as trustworthy as the process initiating it.
- Leverage Zeek for protocol analysis: Zeek’s detailed protocol-level logging provides context that raw NetFlow or firewall logs cannot match. The ability to correlate DNS queries with SSL negotiations with connection metadata – all tied together via UIDs – is invaluable for investigating complex C2 channels.
- Focus on process context in investigations: When network anomalies target trusted infrastructure, immediately pivot to endpoint telemetry. Which process made the connection? What’s the executable path? What’s the parent process? What commands has it spawned? Process context often provides the decisive evidence that network data alone cannot.
- Hunt for suspicious process locations and names: Executables running from user Temp directories, especially those with names mimicking legitimate system utilities or well-known applications, warrant investigation. Implement automated alerts for process creation events in suspicious locations.
- Monitor for reconnaissance command patterns: The sequence of commands observed in this investigation (netstat, tasklist, net user, systeminfo, ipconfig) is extremely common in post-exploitation phases. Create detection rules or hunt queries that alert on rapid sequences of these enumeration commands, especially when executed by unexpected processes.
- Correlate network and endpoint data regularly: The most effective detection in this case came from correlating RITA’s behavioral alerts with Sysmon’s process telemetry. Ensure your security operations have workflows and tools that facilitate this correlation. SIEMs are valuable here, but even manual cross-referencing during threat hunting exercises can yield significant findings.
Final Thoughts
The detection of this GC2 compromise demonstrates that even as attackers adopt increasingly sophisticated evasion techniques – leveraging universally trusted cloud infrastructure, using legitimate APIs, and encrypting all communications – they still leave detectable traces through their operational behaviors.
The key insight is that we must evolve our detection strategies to match adversary evolution. We can no longer rely primarily on signature-based detection or reputation-based blocking. Modern threat hunting must be behavior-driven, baseline-aware, and context-rich. Tools like RITA and AC-Hunter that specialize in behavioral anomaly detection have become essential precisely because they can identify malicious patterns even when the infrastructure being abused is completely legitimate.
Equally important is the recognition that no single data source provides complete visibility. Network behavioral analysis identifies suspicious patterns, but endpoint telemetry provides attribution and intent. Zeek logs provide protocol context, but Sysmon provides process context. Only by integrating and correlating data from multiple sources – network, endpoint, and application layers – can we build the comprehensive visibility required to detect and respond to modern threats.
This case also highlights an often-overlooked principle: trusted does not mean trustworthy. The destination may be Google, but the process initiating the connection might be malware. The protocol may be HTTPS, but the payload might contain stolen credentials. The API may be OAuth, but the token might belong to an attacker. We must look beyond the surface legitimacy of network connections and examine the full context – timing, volume, process attribution, and operational patterns – to distinguish benign from malicious activity.
Finally, this investigation reinforces that behavioral analysis is not just about detection – it’s about providing context and reducing false positives. Organizations generate millions of Google Workspace connections daily. Without behavioral analysis, investigating all of them would be impossible. RITA and AC-Hunter narrow the field to the handful of connections that genuinely warrant investigation, dramatically improving the efficiency and effectiveness of security operations.
As threat actors continue to abuse trusted services for C2 operations, the combination of behavioral network analysis and comprehensive endpoint telemetry will only grow more critical. The organizations best positioned to detect these threats are those that have invested in layered visibility, behavioral baselines, and the analytical workflows necessary to correlate data from multiple sources into actionable intelligence.
Happy Hunting!
Faan
Capture Files
PCAPs
Because… PCAPs, or it didn’t happen. 😊
The following PCAP files are packet captures taken from the same lab environment over a 24-hour time frame. The files were generated using Wireshark from the target host and include normal Windows OS traffic and normal network broadcast traffic. They have not been edited. The PCAPs are safe, standard PCAP files and do not include any actual malware.
GC2 Google Workspace C2 24 Hour Capture
gc2_google_workspace_24h.pcapng
File Size: 1.6 GB
SHA-256 Checksum: 9D9197E6B9893850988CEA519C7770DC3F4DD64E11A50E289D75741436B3D38E
Zeek Logs
If you are an AC-Hunter or RITA user, we are providing the 24-hour Zeek logs for you to import directly into AC-Hunter or RITA. The following Zeek Logs have been taken from the same lab environment over a 24-hour time frame and include normal Windows OS traffic and normal network broadcast traffic. They have not been edited. The Zeek logs are safe, standard log files and do not include any actual malware.
Importing Zeek logs into AC-Hunter or RITA example:
ssh into your AC-Hunter or RITA server and upload all the Zeek logs contained in the zip file below (all files that have the ‘.log’ extension) into a temporary directory on the server. In this example, we are uploading the Zeek logs into /tmp/zeek_gc2_24h/
Then run the following command:
For AC-Hunter v6.x and RITA v4.x and earlier:
rita import /tmp/zeek_gc2_24h/*.log zeek-gc2-24h
For RITA v5.x+:
rita import --logs=/tmp/zeek_gc2_24h/*.log --database=zeek-gc2-24h
You will now have a new database in the AC-Hunter UI/web interface or RITA CLI titled “zeek-gc2-24h” you can select and view.
GC2 Google Workspace C2 24 Hour Zeek Logs
zeek_gc2_google_workspace_24h.zip
Size: 297.9 KB
SHA256 Checksum: 5770F39353CE5E07103075374484CFABD1FDAE85FA3FB59A6DE34DC104C861C7
Discussion
Want to talk about this or anything else concerning threat hunting? Want to share how good (or not so good) other detection tools were able to detect this sample?
You are welcome to join our Discord server titled “Threat Hunter Community” to discuss topics surrounding threat hunting. We invite you to join our server here.

Faan is a security researcher specializing in detecting post-exploitation malware, with a focus on network communication. He likes exploring threat hunting via a purple team approach by simulating adversarial activity to develop novel threat hunting detections. He also loves building covert channels and unusual malware communication methods, creating threat emulation tools that inform new detection vectors.