Detecting Google Services Malware

In our previous blogs, we covered how malware can use Domain Fronting to bypass many of the security tools we use to detect evil leaving our network.
Now, let’s take a few moments to talk about ways advanced adversaries can use other services like Gmail to establish command and control out of our environments.
There are a very large number of different POC malware specimens to get started to better understand this threat.
Below are a couple:
First Gcat, it is just awesome:
https://github.com/byt3bl33d3r/gcat
Second is Sneaky-Creeper:
https://github.com/DakotaNelson/sneaky-creeper
Both of these tools demonstrate how we can use services like Gmail, SalesForce, and Tumbler as a C2 channel.

We run these types of backdoors at Black Hills Information Security because many of the traditional signature-based detection tools tend to ignore all the traffic that goes to these sites.
And, in a weird way, ignoring traffic to sites like Google kind of makes sense. First, it allows the traffic to flow… Faster. Because the spice must flow. Second, in the case of Google, imagine if every time you googled a Linux command it fired an alert…
“Every time an alert is generated, it shows that I am an idiot…” – John Strand
So, once again, we can use RITA for this.
RITA can be found here:
https://www.activecountermeasures.com/free-tools/rita
However, we are going to use AI-Hunter to show the visualizations.
First, a little bit of background on “normal” Gmail interactions. When you are logged into Gmail there is some level of beaconing behavior. But, we found that “normal” beaconing is not all that regular. In fact, human Gmail traffic has a number of attributes that cause it not to register as high on our detection in RITA. For example, the data size tends to be all over the place. This is because the emails that refresh and the notifications tend to be random. Just as the data being sent to users tends to be random.
But, when many backdoors like Gcat fire they have a very consistent data size:
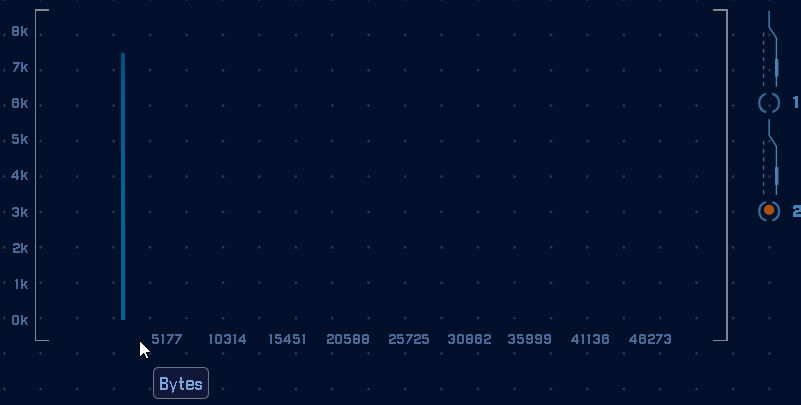
In the graph above you can see there are over 7,000 connections with the exact same data size. We can use this to detect the backdoor.
Also, the interval is pretty strong as well:
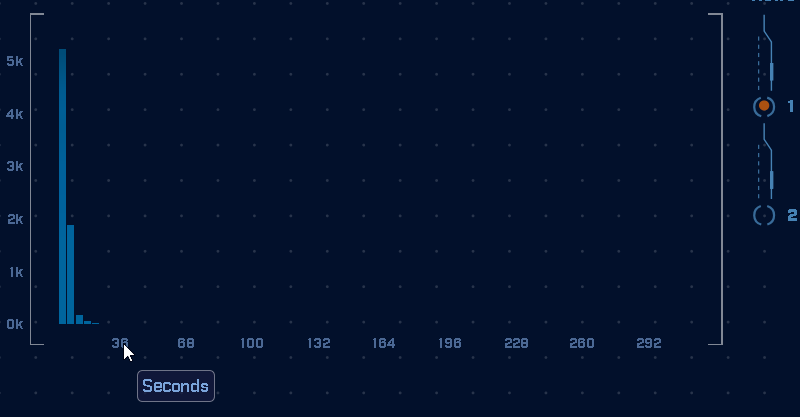
However, in the above data graph, we can see that the connections are not perfect in interval. However, they are clustered. That is why we use a modified version of K-means. We need to find clusters. We’re not looking for perfect, RITA is looking for tight clusters of consistency in the data.
Thanks!
John Strand

John has both consulted and taught hundreds of organizations in the areas of security, regulatory compliance, and penetration testing. He is a coveted speaker and much loved SANS teacher. John is a contributor to the industry shaping Penetration Testing Execution Standard and 20 Critical Controls frameworks.