Malware of the Day – Magnitude

What is Malware of the Day?
Lab Setup
Malware: Magnitude
AKA: Magnitude Exploit Kit, Magnitude EK
Traffic Type: Crimeware
Connection Type: Reverse HTTP
C2 Platform: Cobalt Strike
Origin of Sample: https://github.com/rsmudge/Malleable-C2-Profiles/blob/master/crimeware/magnitude.profile
Host Payload Delivery Method: Powershell one-liner
Target Host/Victim: 192.168.99.52 – Windows 10 x64
C2 Server: 68.183.138.51
Beacon Timing: 45s
Jitter: 50%
Brief
Our focus is on identifying and detecting network beaconing behavior. We are using AI-Hunter/RITA as our network threat and C2/beacon detection platform to visualize the network traffic generated from running the Magnitude malware replication. We encourage you to download and use the PCAP files included in the next section to analyze these files independently using your preferred threat hunt platform to test your detection capabilities.
This week we are stepping up the difficulty of detection once more.
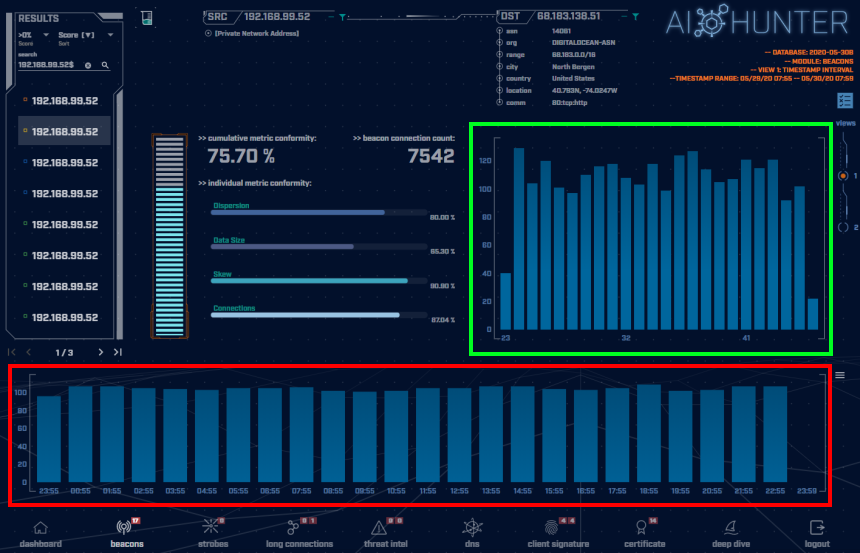
The above screenshot is taken of the AI-Hunter Beacons module from a 24-hour traffic capture. The Magnitude traffic has been detected as a beacon signal of 75.70%.
In the green highlighted box is the beacon timing showing the number of connections of each interval of time in seconds. Here we can see a range of a fairly equal distributions of connection timings from 23 second intervals up to 46 second intervals. This is where the Magnitude connection timing patterns differ from most malware C2 heartbeats and makes it more difficult to detect. Commonly, malware C2 heartbeats will have one strong signal at a particular time interval that will create an obvious peak that will stand out in a graph, even with jitter. Here we have multiple strong signals that spread out across the total number of connections.
Viewing the connections timing in a graph like this we can observe the jitter that has been introduced into the timing of a deviation of 50% from 45 seconds, creating a range of intervals from 23 to 46 seconds. This considerable amount of jitter will most likely spoof most beacon detection tools that are looking for very rigid timing patterns. Adding the flat distribution of the number of connections per interval adds a layer of stealth. These consistent clusters of connection timings are still evidence of programmed machine communications.
In the red highlighted box above are the number of connections per hour (each blue block is a one-hour time frame). The consistency of the number of connections per hour is a tell-tale indicator of non-human behavior. Notice the flatness and uniformity of the hourly histogram. Even with an aggressive 50% jitter of our Magnitude beacon timing, note how the jitter normalizes-out when viewing hourly chunks over an extended period of time. Normal users’ traffic will be much more random in nature and would display greater peaks and valleys in the graph over time.
Observing the consistency of the total number of connections over 24 hours is amplified by switching the histogram to a 5 minute chunk view as shown in the above image. Notice how we can draw a flat line across the average and how uniform the traffic is. We are observing approximately 8 connections every 5 minutes. This does not mean it is necessarily evil, but it does tell us it is programmed.
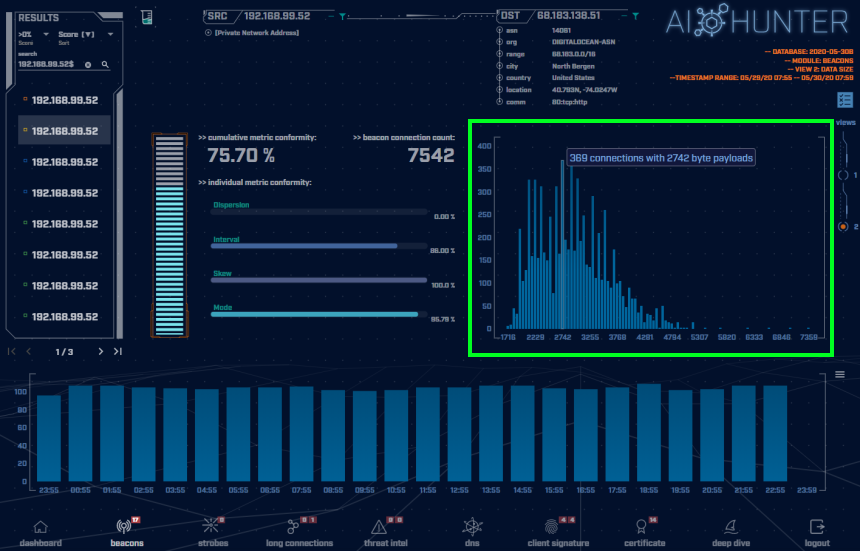
Switching to the connections Data Size view (shown in the green highlighted box above) is where things get even more interesting. Again, commonly, malware C2 heartbeats will have one strong signal at a particular data size that will create an obvious singular peak that will stand out in a graph. As can be seen in the above graph, the Magnitude payload sizes have a broad distribution which makes the connections appear unique and similar to normal network traffic. For this sample, the greatest number of connections of the same data size is only 369 connections out of 7542. This adds to the complexity of detecting the Magnitude traffic.
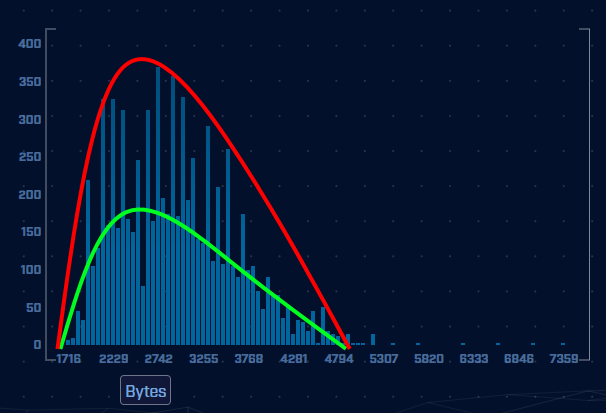
However, we can detect this as programmed communications by observing the plot of connection data sizes. Normal traffic will be truly randomized and will present the data as being scattered across the graph. Since programming languages cannot truly randomize, what will be observed from programmed randomization is pseudo-randomization. Pseudo-randomization when plotted in a graph will recurrently present itself as a bell curve. This can be clearly seen in the image above. Note how the two communal plot lines are showing a clear bell curve. This data size analysis is confirming these are most likely programmed communications and should be investigated.
A similar beacon analysis can be performed using our open-source framework RITA ( RITA information and download page (free) ). RITA detected the Magnitude sample traffic as a threat, giving it a score of 0.757 (75.7% beacon/threat). The network RITA is analyzing is our malware lab and the Magnitude sample is definitely a threat to be investigated.
Capture Files
Because… PCAPs, or it didn’t happen. 😊
The following PCAP files are packet captures taken from our lab environment over a one-hour time frame and a 24-hour time frame. The files were generated using Wireshark from the target host and include normal Windows OS traffic and normal network broadcast traffic. They have not been edited. The PCAPs are safe, standard PCAP files and do not include any actual malware.
Magnitude 1 Hour Capture
magnitude_1hr.pcap (served by Dropbox)
Size: 25.8 MB
MD5 Checksum: 8f58ab0b9a0cfa7e12ed81e1b0e9e934
Magnitude 24 Hour Capture
magnitude_24hr.pcap (served by Dropbox)
Size: 628 MB
MD5 Checksum: 9854c9075b343153d692af9537f7315e
Discussion
Want to talk about this or anything else concerning threat hunting? Want to share how good (or bad) other detection tools were able to detect this Magnitude sample?
Join our Discord server titled “Threat Hunter Community” to discuss topics surrounding threat hunting. We invite you to join our server here.
Additional Resources
https://securelist.com/magnitude-exploit-kit-evolution/97436/
https://www.csoonline.com/article/2459925/exposed-an-inside-look-at-the-magnitude-exploit-kit.html
Until the next!

Keith’s appreciation for computing and processes originates from working with his first personal computer in 1982, a TI-99/4A. Keith sees himself as fortunate for the opportunity to apply his passion towards a career that assists in the advance of technology and continuing education.


