Malware of the Day – Attack Vectors: Google Apps Script
What is Malware of the Day?
Lab Setup
“Malware”: google_RAT
MITRE Tactics: TA0011 Command and Control, T1090 Proxy
Traffic Type: Generic
Connection Type: HTTPS
C2 Platform: google_RAT
Origin of Sample: https://github.com/a-rey/google_RAT
Host Payload Delivery Method: Python Script
Target Host/Victim: 10.20.57.3 – Ubuntu 20.04
C2 Server: 157.230.93.100
Beacon Timing: 7s
Jitter: 60%
Brief
Our focus is on identifying and detecting network beaconing behavior. This week we are looking at the traffic generated by running the open-source command and control channel google_RAT.
One way attackers can hide their tracks is to use legitimate web services as a proxy for their command and control servers (MITRE ATT&CK Tactic T1090). This makes it harder for defenders to track down malicious connections since the infected hosts do not make a direct connection to the attackers C2 infrastructure. Moreover, since many legitimate services such as Google are constantly load balancing their servers, the IP address of the proxy can change frequently. This makes it harder to track the connections and blacklist IPs.
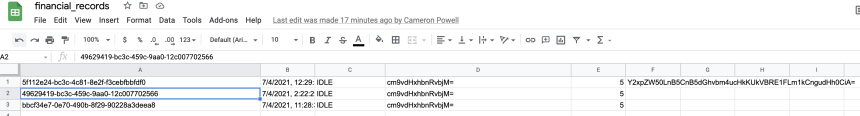
google_RAT is a C2 platform that uses Google Apps Script as a C2 proxy. Google Apps Script is a platform for rapid development of apps and plugins that integrate with G-Suite products. google_RAT requires the user to create an empty google-sheet with open access and edit permissions. Then a google apps script must be created which will hold the server code to interact with the spreadsheet and attacker controlled server. As new clients reach out to the server they appear in the spreadsheet as shown in the screenshot below:
After the payload is executed on the target machine, it begins beaconing to the proxy server using https GET requests. The actual C2 server periodically queries the proxy for client UUID’s (Universal Unique Identifiers) and if the attacker has entered any commands, sends them to the proxy to be relayed to the target machine. Targets can be removed by deleting their UUID in the google-sheet.
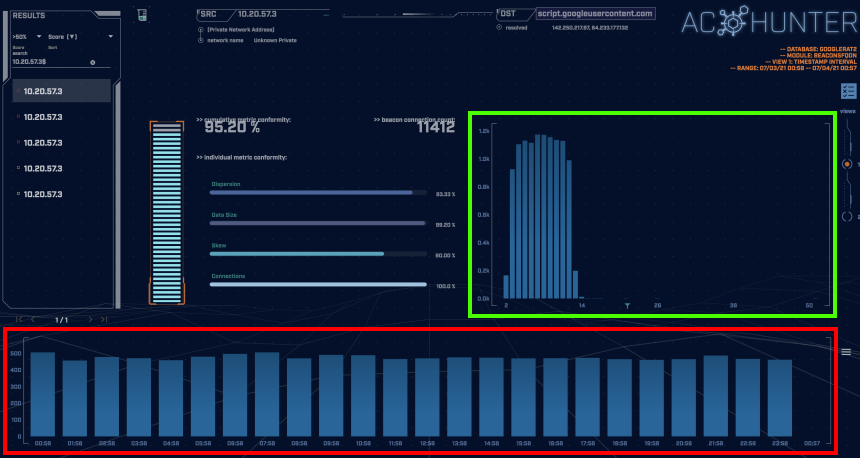
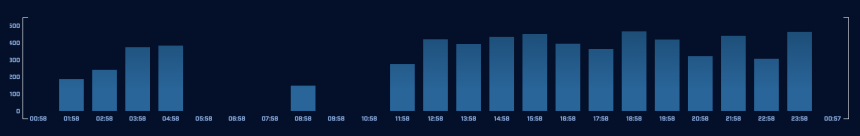
The above screenshot is taken from AC-Hunter’s “beacon fqdn” module. This module classifies beaconing behavior by the domain the traffic is going to rather than the IP address. We can see the host is sending requests to “script.googleusercontent.com” fairly consistently. The graph highlighted in green shows that connections are evenly distributed between 3 and 12 seconds apart with the majority being 7 seconds apart. The jitter in the connection informs us that the connection is unlikely to be a legitimate service and the frequency of connections (~500 per hour highlighted in red above) indicates that this is not likely to be legitimate traffic.
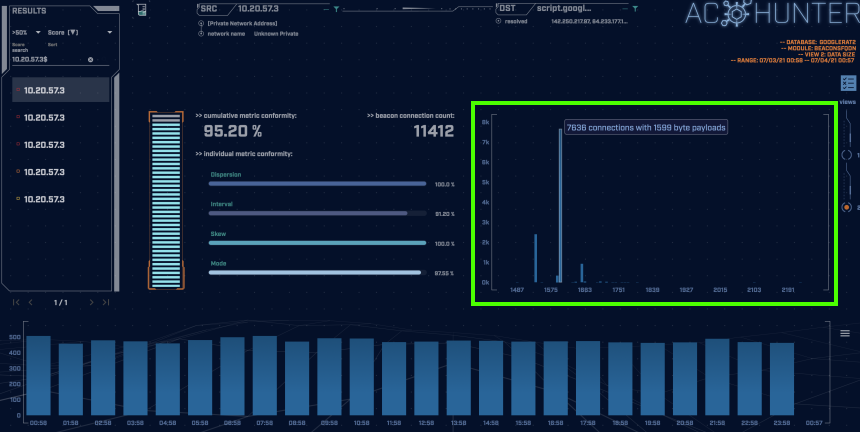
Switching to the data size view (shown in the green highlighted box above), we can see the majority of communications have a 1599 byte payload. The uniformity in connection size confirms that they are unlikely to be made by a normal human user. Looking closer we can see that there are some larger connection sizes spread out near the bottom of the graph. These are likely to be a result of the adversary interacting with the client and sending commands.
This type of analysis can also be done using RITA. The output of the command “rita show-beacons-fqdn -H” is shown below:
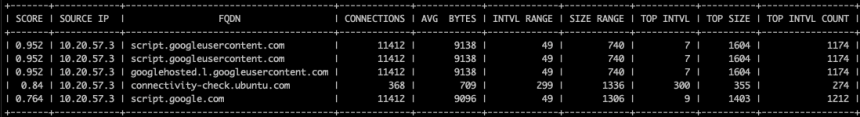
The ability to look at beacons going to a specific fully qualified domain name rather than an IP address was the key to finding this suspicious traffic. Notice how running the regular “show-beacons” (to IP’s) command below shows us significantly lower scores than we see above:
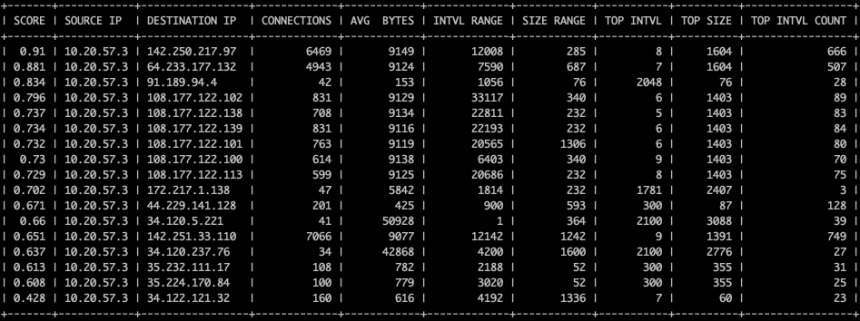
This is because the connection graphs are cycling through multiple IP’s and therefore each one has a more natural looking connection pattern as seen below, as well as fewer connections overall. This run of the google_RAT program used only 2 remote addresses, however there are often many more utilized in a real-world compromise.
We encourage you to download and use the PCAP files included in the next section to analyze these files independently using your preferred threat hunt platform to test your detection capabilities.
Capture Files
Because… PCAPs, or it didn’t happen. 😊
The AC-Hunter results above are a 24-hour observation and analysis from Zeek logs running in a lab 24/7. The following PCAP files are packet captures taken from the same lab environment over a one-hour time frame and a 24-hour time frame. The files were generated using Wireshark from the target host and include normal Windows OS traffic and normal network broadcast traffic. They have not been edited. The PCAPs are safe, standard PCAP files and do not include any actual malware.
google_RAT 1 Hour Capture
google_rat_1hr.pcap
Size: 13.3 MB
SHA256 Checksum: 18AA0B0CE9EFC55C78846DAD2E78A54001EE8C32F1E54FC03EA9FB6FE47D9369
google_RAT 24 Hour Capture
google_rat_24hr.pcap
Size: 229 MB
SHA256 Checksum: 12171C80890F66DC34256FD27B8C1902075382A8B4AD2BE4E5CE3AED2966C014
Discussion
Want to talk about this or anything else concerning threat hunting? Want to share how good (or not so good) other detection tools were able to detect this sample?
You are welcome to join our Discord server titled “Threat Hunter Community” to discuss topics surrounding threat hunting. We invite you to join our server here.

Hannah joined Active Countermeasures as an intern in 2020. She is currently a graduate student at the University of Utah.