Sorting tshark’s Conversation (conv) Output

Intro
Tshark’s “conversation” (conv) option is a great way to produce summary information of the conversations included within a pcap file. Unfortunately, the sort options are coded directly into the application. This means that you have little control over how the information gets displayed. In this blog post I’ll talk about how to manipulate the output of tshark’s conversation statistics so that you can sort the data any way that you please.
Tshark’s Conversation Statistics
Sometimes when reviewing a pcap it’s helpful to see summaries of the data flows. This can quickly help you hone in on problem areas. Tshark’s “conversation” switch can be used to produce multiple types of summaries based on OSI layer 2-4 information.
Let’s look at an example. Let’s say you want to see statistics summarized based on source and destination IP address. Running the following tshark command will produce summary output based on source and destination IP address:
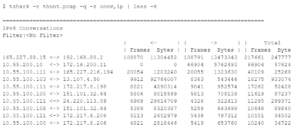
Note that there are two additional columns to the right, relative start time and duration that are not shown in the above output.
As you can see in the above output, the data is sorted based on the total number of frames sent in both directions. While this can be helpful information, what if I want to identify which internal systems are sending the most data to the Internet? With no sort option built into tshark, I have to find another way of manipulating the data.
Selecting Fields With cut
The first thing I will want to do is remove any data I’m not focusing on at the moment. We said we want to identify the internal systems sending the most data to the Internet, but do we mean cumulatively or by target IP address? In this example I’ll do it based on target IP as that is the most helpful for threat hunting. If I want cumulative results I would simply ignore the target IP address as well. So the fields we will want to see are:
- Source IP address
- Destination IP address
- Outbound bytes
I can use the “cut” utility to remove all of the other columns except for these three. With cut, I define the columns I wish to keep. In the above case that would be columns 1, 3 and 7. However, cut expects fields to be separated by tabs. The above tshark output uses spaces. Further, there are a variable number of spaces between each column. Yuck.
Before we can use cut, we need to remove all of the repeating spaces. This can be done with the translate or “tr” command. With tr, we use “-s” to specify the repeating character we wish to reduce to one instance. In this case it will be the space characters, so we would identify that with a set of empty quotes. The syntax we will use is:
tr -s ' '
So we will run our tshark command, use ts to remove the extra space characters, and then use cut to extract only the fields we are interested in. Here’s the command we will use along with the resulting output:
$ tshark -r thunt.pcap -q -z conv,ip | tr -s ' ' | cut -d ' ' -f 1,3,7 | head -15

================================================================================
IPv4
Filter:<No
<- |
Frames Frames
165.227.88.15 192.168.88.2 13473343
10.55.200.10 172.16.200.11 5762493
10.55.100.111 165.227.216.194 1323630
10.55.100.103 13.107.4.50 543444
10.55.100.111 172.217.8.198 952574
10.55.100.100 151.101.32.64 708139
10.55.100.111 24.220.113.59 322413
10.55.100.108 151.101.32.64 663699
10.55.100.111 172.217.8.206 797312
10.55.100.100 172.217.8.206 653760
Wahoo! If you compare this output to the original output, you will see that we’ve extracted the source IP, the destination IP and the number of bytes the source sent to the destination. This is exactly the data we were looking for.
Sorting Our Data
While we have the data we wanted, you may have noticed that it’s not in order. We are still working with the default sorting used by tshark. So we will want to resort the data based on the total number of bytes sent by the source to the destination, highest to lowest.
By default, the “sort” command starts sorting by the first character on a line using alphanumeric format. Further, it sorts from lowest to highest. So we will need to set some options to change these defaults. First, we need to specify that the sorting should be done based on the data in the third column. We will also want to identify this data as numeric and that the data should be printed highest to lowest.
The “-k” switch can be used with sort to tell it which column to sort on. The “-n” switch will identify the data as numeric, and the “-r” switch will sort from highest to lowest. Combining all of this together, our command now look something like this:
$ tshark -r thunt.pcap -q -z conv,ip | tr -s ' ' | cut -d ' ' -f 1,3,7 | sort -k 3 -rn | head

165.227.88.15 192.168.88.2 13473343
10.55.200.10 172.16.200.11 5762493
10.55.100.111 165.227.216.194 1323630
10.55.100.111 23.38.115.36 1213559
10.55.100.111 34.233.92.30 1004220
10.55.100.111 172.217.8.198 952574
10.55.100.111 24.220.113.58 882200
10.55.100.100 23.38.115.36 857424
10.55.100.111 23.52.163.40 847258
10.55.100.111 24.220.113.56 845112
We originally said that we wanted to investigate which internal systems are moving the most data out of our environment. With this in mind, we would look at the top entries where the source IP is a private address and the destination IP is a legal IP address outside of whatever legal IPs we may be using internally.
Additional Variations
Now that we understand the command format to use, we can leverage variations to produce other useful reports. For example, Column 11 in the “conv,ip” statistics identifies connection duration. If we wanted a list of the longest connections that took place, we would simply modify the fields we “cut” from the tshark output:
$ tshark -r thunt.pcap -q -z conv,ip | tr -s ' ' | cut -d ' ' -f 1,3,11 |
sort -k 3 -rn | head

165.227.88.15 192.168.88.2 86398.0701
10.55.100.111 165.227.216.194 86380.3536
10.55.182.100 10.233.233.5 86331.2004
10.55.100.103 64.4.54.254 86289.2045
10.55.200.10 172.16.200.11 86275.3073
10.55.100.100 65.52.108.225 86222.3654
10.55.100.107 111.221.29.113 86220.1262
192.168.88.2 216.229.4.69 86217.0870
10.55.100.106 172.217.8.200 86210.4297
10.55.100.106 104.74.18.73 86210.1624
If we wanted to see which individual TCP sessions were responsible for moving the most data out of our environment, we would use the “conv,tcp” statistics. We would still cut the same columns:
$ tshark -r thunt.pcap -q -z conv,tcp | tr -s ' ' | cut -d ' ' -f 1,3,7 |
sort -k 3 -rn | head

10.55.100.103:60522 134.170.58.189:443 447676
10.55.100.111:61526 134.170.165.248:443 429780
10.55.100.106:56543 191.232.80.60:443 418731
10.55.200.10:53409 191.232.80.60:443 233675
10.55.100.108:61007 191.234.72.188:443 230812
10.55.100.109:58185 134.170.51.190:443 229340
10.55.100.104:63647 134.170.58.123:443 212513
10.55.100.106:53994 191.234.72.186:443 211224
10.55.100.100:52285 65.55.163.221:443 208863
10.55.100.105:64127 65.55.163.222:443 206717
There are quite a few variations that can produce useful reports. The tshark documentation has a full description of all of the conversation statistics that can be reported.

Chris has been a leader in the IT and security industry for over 20 years. He’s a published author of multiple security books and the primary author of the Cloud Security Alliance’s online training material. As a Fellow Instructor, Chris developed and delivered multiple courses for the SANS Institute. As an alumni of Y-Combinator, Chris has assisted multiple startups, helping them to improve their product security through continuous development and identifying their product market fit.