Why Is My Program Running Slowly?

Intro
Why is my program running slowly? It’s because of 4 things: processor, memory, disk, and network connection. We’ll look at each and go into detail about what you can do about them.
This article brings up some approaches you already know, covers a few that may be new, but more importantly gives you a structure to think about these performance issues and solve them in a way that actually makes a difference.
TLDR
Add RAM. Seriously, if you don’t know what to do to solve a performance problem, in many cases adding ram will help.
Replace your rotating media hard drives with SSDs. Since SSDs have no drive head, they do not suffer the delays that hard drives see when reading from or writing to a badly fragmented file or directory.
Assumptions
The concepts in this article apply to any general-purpose operating system and hardware on which it runs. That said, we’re primarily covering Linux tools and techniques as Linux is so widely used as a server platform.
We won’t be covering video issues, audio issues, or any performance problems related to waiting for human input.
The article also assumes that if you’re running into performance problems with one particular program, say, the mysqld database server, that you’ve moved as many other resource hogs off the system as you can. While the troubleshooting concepts here certainly can apply to two or more heavy use programs at a time, it does get trickier to fix two or more problems at once. Get the main heavy use program working well first, and then consider moving something back on this system if the two won’t be fighting over one resource.
What Limits the Speed of a Running Program?
4 things: your processor, memory, disk(s), and network connection. On a given system, a given program is usually limited by one of these. For example, a database server may be running slowly because there’s not enough memory on the system to hold what it needs in memory while providing a disk cache for the database files, perhaps leading to swapping. Adding memory to that system will speed it up immensely – perhaps letting it run 2x-4x faster than before.
To figure out how to solve a performance problem, we first have to figure out what that problem is. To do that we’ll watch the system live and see which of those is fully loaded most of the time.
Seeing the System
lshw
You’ll want to know what hardware is in your system. lshw – “list hardware” is perfect for that. For a quick summary of the installed processors, memory, disks, and network devices, try:
sudo lshw -short | less
Here’s the display from a DigitalOcean cloud server (important parts bolded):
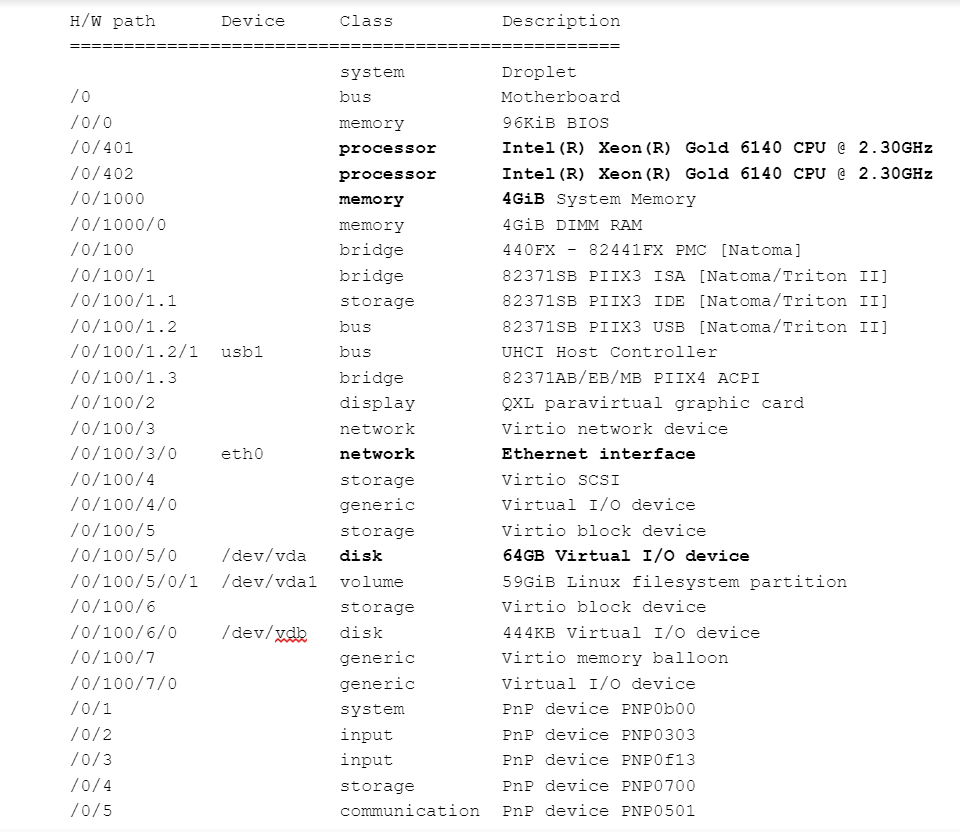
If you leave off the “-short” option, you get a great deal more detail, including exactly what memory is plugged into what socket, processor capabilities, filesystem’s types, and mount options, and much more.
lshw comes with most Linux distributions. It tells you nothing about utilization, but knowing that you have 4GB of memory and have 6 more ram slots to fill can make it easier when it comes time to order some more memory.
gkrellm
You need to be able to view how the system is running to understand why it’s running more slowly than you want. My tool of choice is gkrellm. This program runs on Windows, Mac, and Linux, and has helped me identify the source of lots of performance problems over the last few decades. (Intro article: http:/ /www.stearns.org/doc/network-monitoring.current.html )
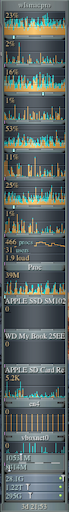

It’s designed to stay on one side of your desktop and thin enough that you can leave it up while doing your normal work. Each area shows one resource; the left hand image shows a work laptop. From top to bottom:
– System name
– 8 windows, one for each processor core
– 1 window for the system load (including how many logins and processes there are)
– 3 windows, one for each disk
– 2 windows, one for each network interface
– 1 small window for swap activity
– Memory free meter
– Swap free meter
– 3x disk free space meters
– Uptime
If you look at the past-1-minute display immediately above “Apple SSD SM102”, you’ll see both yellow pixels down at the bottom and grey pixels above those. The yellow pixels are writes, the grey ones are reads. This lets you know whether your disk is straining under heavy read activity or write activity. You’ll want to know which is more prevalent as there are different techniques to solve reads versus writes. The “39M” in the upper left shows you how much traffic went to/from this disk in the last second.
As a side note, the right-hand image above is a more customized version of gkrellm – you can put in additional monitors (both built-in and plugins) to let you watch even more of the system.
One other nice plus about gkrellm is that you can run gkrellm on multiple machines and bring their displays back to your laptop or some other network monitoring system. The intro article above covers how to do this over ssh. This lets you run this (graphical) application on a server that has no graphical desktop of its own by bringing the display back to a laptop that does have a desktop.
Gkrellm is included in many Linux distributions, available in Mac ports, and is a download from http://www.gkrellm.net/ for Windows.
atop
A very good second choice for monitoring system performance is atop. It’s similar to top, in that it gives a one-line-per-process summary of what’s running with a header up top with some general system info. The difference is that it gets much deeper into specific devices (individual disks, network cards, etc):
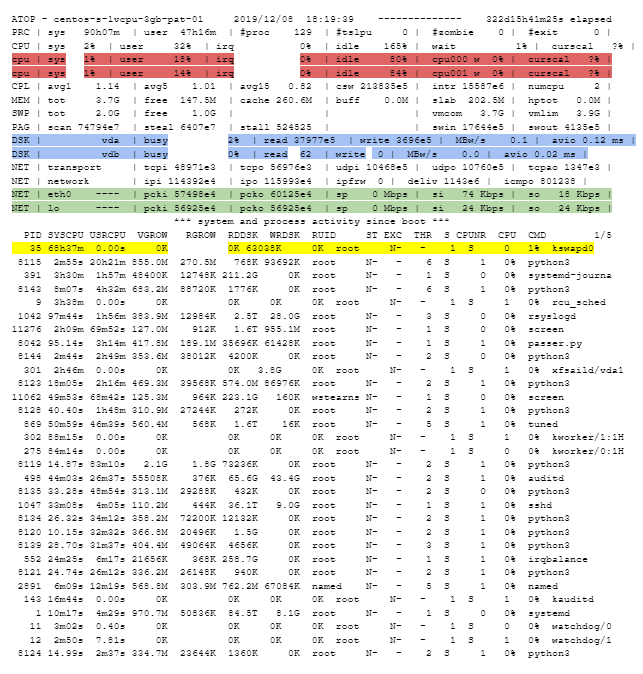
The above display shows up right after it’s started; for the first 10 seconds it shows cumulative activity since boot (after that it switches over to current activity, just like top). The yellow highlighted line shows the process that’s used the most CPU time since boot: kswapd0, the task responsible for swapping on the system. That immediately shows me that this system is spending way too much time swapping and needs more ram.
Note that atop shows individual processor cores (highlighted in red above), individual disks (in blue), and individual network interfaces (in green). On a system with multiple disks, it’s important to be able to identify which disk or network interface is overloaded, and atop shows that. In fact, it even shows stats on how many reads, writes, megabytes read/second and megabytes written per second on each disk (though they’re truncated on the above screenshot), and how many packets in and out for each network interface.
atop is also included in many Linux distributions, though it doesn’t appear to be available for Mac OS or Windows.
Activity Monitor
This app can be found on Mac OS systems in the Utilities folder. In addition to memory and CPU utilization, it covers disk bytes written, disk bytes read, network bytes written, and network bytes read per process.
top
Top does give some basic statistics, and is included with all Linuxes, Unixes, and Mac OS, but it’s limited. It doesn’t really give enough detail on what’s happening at the individual device level to help you do this kind of troubleshooting. That said, it can still report on the processes using the most memory (Linux systems: press “M”, BSD and MacOS: press “oMEM<Enter>”) or most processor time (Linux systems: press “P”, BSD and MacOS: press “oCPU<Enter>”).
Identifying the Specific Issue
Now that you have gkrellm, atop, or your favorite monitoring tool running, we need to find both the specific device that’s the bottleneck and figure out what kind of bottleneck it is.
Processor
Look at the individual processor cores and how heavily they’re loaded (from 0-100%). Each processor core that’s generally close to 100% loaded (>=90%) is a bottleneck. If your atop output shows your program of interest running close to filling a processor, that’s a good sign to go down to fixing a processor bottleneck.
If your program of interest should be filling a processor but it’s nowhere near 90% usage most of the time, you need to check the other three resources below.
Disk
OK, so the processor’s not the bottleneck. Let’s look at the disk holding your active data.
The first question is how fast can I move data on or off this disk? To check, wait for a time when you’re not using that disk and write a large file to a temporary directory on it (“/mnt/workdisk/tmp/” in the example. Please type carefully):
sudo mkdir /mnt/workdisk/tmp
sudo chown myaccountname /mnt/workdisk/tmp/
dd if=/dev/zero of=/mnt/workdisk/tmp/deleteme-zeros.txt bs=1048576 count=8192
8192+0 records in
8192+0 records out
8589934592 bytes (8.6 GB, 8.0 GiB) copied, 66.5494 s, 129 MB/s
If you have more than 8192MB of memory being used to cache disk access, increase the files size (replace 8192 with a number of megabytes larger than the cache ram available).
While the file is being created watch gkrellm’s picture of this disk – you’ll see a solid block of yellow pixels and the number of megabytes/second will be displayed at the top left. In my case, the 129MB/s at the end of the command output essentially matched the transfer rate shown by gkrellm.
Now do a read of the disk with:
dd if=/mnt/workdisk/tmp/deleteme-zeros.txt of=/dev/null
16777216+0 records in
16777216+0 records out
8589934592 bytes (8.6 GB, 8.0 GiB) copied, 44.9749 s, 191 MB/s
Disk reads are faster than writes, so it’s not surprising that we get about 190MB/s on reads.
Don’t forget to delete the file when done:
rm /mnt/workdisk/tmp/deleteme-zeros.txt
Now that you know these two numbers, watch the disk during normal use:
- If you see primarily reads and the bandwidth from the disk is generally somewhere over 70% of your maximum read rate, your disk is being used for long streaming reads. These are reads that read large blocks of data without a lot of seeks.
- If you see primarily writes and the bandwidth to the disk is generally somewhere over 70% of your maximum write rate, your disk is being used for long streaming writes. These are writes that write large blocks of data without a lot of seeks.
- If you see primarily reads and the bandwidth from the hard disk is generally below 25% of your maximum read rate, your disk is being used for short random reads. These are reads that read small blocks of data with a lot of seeks.
- If you see primarily writes and the bandwidth to the hard disk is generally below 25% of your maximum write rate, your disk is being used for short random writes. These are writes to small blocks of data with a lot of seeks.
- If you see occasional reads or writes, but most of the time the disk is idle (0 bytes/second or close to it), the disk is not the bottleneck – move down to the next check.
- The short random reads/short random writes apply to hard disks, not SSDs. SSDs don’t have heads that you find in hard disks, so they don’t slow down when the kernel moves all over the disk for reads or writes. That means that you should see long streaming reads, long streaming writes, or mostly idle on SSDs.
Network Interface
The maximum bandwidth for a network connection is obviously simpler – a Gigabit Ethernet device is limited to 1,000 Gb/s or 125 GB/s. A Linux system can keep most of that theoretical bandwidth full, so it’s not unreasonable that you can move 100-120MB/s through a Gigabit Ethernet adaptor or 10-12MB/s through a 100Mb/s Ethernet adaptor.
When you watch the network adapter, are you seeing reads, writes, or both that are regularly over 70% of your theoretical maximum? That implies you have a network card bottleneck. If your bandwidth holds far lower or goes almost completely idle for long periods, that implies the limit is somewhere else.
Keep in mind that an Ethernet network is a shared network, so if 5 computers are flooding a Gigabit Network switch with as much traffic as they can generate, it’s quite reasonable that they each get less than 200Mb/s (25MB/s). If you have multiple devices fighting for bandwidth, that’s a good time to look at upgrading network adapters, network switches, switch interconnects, and Ethernet cables (if your existing ones aren’t rated for the new speed).
Memory
To see if memory is the issue, take a look at swap first. In atop, look at the PAG line, and specifically the swin (swap in) and swout (swap out) measurements. If these are occasional (less than 100 each in a default 10 second period), the system is not actively moving memory out to or in from disk. When one or both of these stays above 2000 in each 10 second period, the system is drastically short of memory and desperately trying to free up memory for programs that don’t have enough. When the system is pushing actively used memory to swap space to make space for other actively needed memory, it enters a swap storm where effectively every running application is being stalled and the system can act like it’s hung.
You’ll also want to look at the output from:
dmesg | less
This command shows the debugging output from the kernel. If that output includes any reference to an “OOM Killer” or “Out of memory killer”, you know the kernel got to a point where there was no more memory to hand out and had to kill the process that most recently requested some (which is commonly, but not always, the process that has asked for the most memory). If you see this, you can stop debugging here – add memory to this system.
Why can’t we use the amount of “free memory” (top and atop: “Mem…. free”) to diagnose whether we’re running out of memory? Because the Linux kernel takes all the ram not being used by programs and uses it for disk caching (top: “Mem…buff/cache”, atop: “Mem…cache”). If the amount being used for disk caching is very small (less than 20MB), that is a sign that you are probably swapping programs in and out, but it’s easier to use the swin/swout approach above to be sure.
Fixing The Problem
Keep cloud servers in mind for these solutions. You may not have a system with 192G of memory and 32 processors for a short term processing job, but you can have one at DigitalOcean for $1.43/hour and discard it when you’re done. Cloud servers can commonly be resized as well – you can load your OS, applications, and data onto a small cloud server, resize it to have much more ram and processing capacity during a processing run, and resize it back down when the job is complete.
Cloud platforms also make it easier to add one or more additional virtual drives/block devices on the fly (for additional capacity and potentially additional bandwidth, though you can’t be sure that two virtual block devices don’t share a single underlying disk). When using any cloud service, make sure your Cloud Server is running on an SSD; if you’re sharing a rotating media hard drive with other cloud users, you can see your performance drop dramatically and inexplicably when someone else is hogging the disk.
Make sure you shut off all processes and services that aren’t needed on the system. Set up a firewall in front of the system that drops all unwanted incoming traffic.
Memory
- Add more.
- Shut down unneeded programs and daemons
- Check the configuration of the programs using the most memory (run “top” and press “M” to sort with highest memory usage at the top of the output). See if any of them have tunable values for how much memory they use, especially for in-memory caches, and reduce those and restart the application.
- Consider moving the memory hogs from the previous check over to another system with more ram.
- Make sure you have at least a small amount of swap space (at least ¼ of your ram is recommended) even on systems with small disks. The Linux Kernel can recognize blocks of memory that were allocated for running programs that haven’t been used in a long time. By pushing them out to swap that frees up some ram for active use without having to kill the programs in question.
Disk
General
If you’re using rotating media hard drives for your data, keep in mind that seeks are the most time-consuming task that a server-class operating system does. In the time it takes to perform a single seek, you could have read or written between 100KB and 150KB of data. Multiply that times thousands of seeks to read a massive directory – or a badly fragmented file – and you can destroy the disk performance of an otherwise capable hard drive.
SSDs don’t suffer from this problem – there’s no hard drive head to move – so moving from a hard drive to an SSD can immediately help when the access pattern has lots of short/random reads or writes.
- Add ram
- Spread the load out to multiple drives
- Swap space to its own disk
- Ext4 journal to its own disk
- OS on its own disk
- Application data to its own disk, possible even segregating by app
- Set up multiple disks for application data and spread reads/writes over them
- Using Btrfs to handle both raid redundancy and spreading the load to multiple disk
- Defragment files (turns random writes/reads into streaming writes/reads)
- If data is read/written at random, do processing on a ramdisk/tmpfs volume
- Make sure the system is on a UPS
- Copy data from long-term storage to a ramdisk/tmpfs volume
- Process the data
- Copy results back to long-term storage regularly, and consider how to make sure you also perform this copy before shutting the system down.
- Tune running processes’ disk priority
- See “Using ionice to prioritize disk traffic” below
- On systems with large numbers of directories, adjust mount to use relatime.
- Turn off any disk indexing tools (for example, Spotlight on Linux and Mac OS).
- Schedule backups for hours where the disk load is lighter.
Long Streaming Reads
- RAID 1 mirroring
- Btrfs
- If you’re using hard drives, consider moving to 15k rpm drives.
Long Streaming Writes
- RAID 10 (striping+mirroring)
- Btrfs
- Dedicated disk(s) for long incoming data stream. Regular rotation, and process data on idle drives
- If you’re using hard drives, consider moving to 15k rpm drives.
Short Random Reads
- Add ram to cache more disk
- Use SSDs instead of hard drives (or at least 15k rpm hard drives)
- If the cost of replacing all your storage space with SSDs is prohibitive, consider placing active/recently modified files on SSD storage and regularly move active/older/archive files to hard drive storage.
- Break up huge directories into directory trees.
- Stop using small files for storage – use a database of some kind for massive numbers of small files.
Short random writes
- Use SSDs instead of hard drives (or at least 15k rpm hard drives)
- If the cost of replacing all your storage space with SSDs is prohibitive, consider placing active/recently modified files on SSD storage and regularly move active/older/archive files to hard drive storage.
- Possibly increase journal size and move it to a separate disk
- Break up huge directories into directory trees.
- Stop using small files for storage – use a database of some kind for massive numbers of small files.
Network
- If data is stored remotely, do the processing on the system that has the data.
- Accessing large amounts of data over SMB/NFS is generally acceptable performance
- Accessing huge directories of smaller files over SMB/NFS can be terrible performance
- If local network traffic (management, upgrades, backups, fileserver access, etc) takes up a significant portion of your bandwidth, set up a second network segment for this local traffic. (Many cloud providers offer this at no cost for inter-cloud-server traffic.)
- If you’re running a high volume server with a slow network link, set up a reverse caching proxy out on the Internet. Also, push out static content onto a separate server on the Internet, freeing up bandwidth (and processor time) for dynamic content.
- Try enabling jumbo frames.
Primarily Reads/Downloads
- Download objects before you need them
- Cache all results
- DNS requests? Run a local caching nameserver and use it for all queries
- HTTP/HTTPS/FTP requests? Run squid and direct all outbound requests to it
- Set up a second network interface for bulk downloads
- If the bottleneck is the system’s network interface, go to a faster network card or bond multiple network cards together.
- Compress data before downloading
- Or during the transfer (scp -C …, rsync -z …, tar -cz …, ssh -C …, )
- Use bandwidth limiting on lower priority downloads
- rsync –bwlimit=200 … #Limit total bandwidth used to 200MB/s
Primarily Writes/Uploads
- Set up a queue of outbound objects that can be sent later when the urgent objects have been sent
- Compress data before uploading
- Use bandwidth limiting on lower priority uploads
- rsync –bwlimit=200 … #Limit total bandwidth used to 200MB/s
Processor
- Break up the processing work so multiple copies of the program are running, each on their own part of the data. If you have more tasks than (processor cores+1), consider splitting the work up onto multiple systems
- Redesign/reconfigure the program to use more than one processor at once (multiprocessing; bzip2 vs pbzip2)
- Faster processor cores and/or higher-end CPU with more memory cache
Examples
Ramdisks and tmpfs Overview
There will be occasional times when you need blazingly fast file access and the disks you have simply can’t keep up. This could be because… 1) the raw write speed isn’t high enough, 2) the raw read speed isn’t high enough, 3) the files are accessed randomly with lots of seeks and you’re using a hard drive, or 4) there are a very high number of small transactions.
The Linux kernel provides 2 major ways to present part of your ram as if it was a physical disk – ramdisks and tmpfs. With a ramdisk, you specify how much ram is needed, and that memory is allocated for the ramdisk and only the ramdisk until the disk is unmounted and totally removed. With tmpfs, you still specify a maximum size, but the individual blocks of memory aren’t allocated until you actually store a file on the tmpfs volume.
Think of it this way; if you store 3 1megabyte files on a 1gigabyte ramdisk, you lost 1gigabyte of ram when the ramdisk is mounted and it doesn’t matter how full it is – that 1gigabyte is not available for anything else. If you stored those 3 1megabyte files on a tmpfs volume instead, the volume would take 3megabytes of ram to hold them. When you delete two of those files from the tmpfs volume, 2 megabytes of memory are returned to the system for another use.
As one side note, if your system becomes very short of ram, the least recently used files on a tmpfs volume may get pushed out to swap. This frees up some ram, but it also means the tmpfs volume will later need to pull this content back in. So there’s the tradeoff – ramdisks must always take all the memory they might ever need but never risk getting part swapped out, while tmpfs volumes only allocate memory when needed, but risk running at disk speeds under heavy load.
With both ramdisks and tmpfs volumes, if the power goes out all your content on ramdisks and tmpfs volumes goes away. That’s why you must… 1) Load any needed content/directories onto them at boot time, 2) Regularly back up the content onto actual SSDs, 3) Move the content back to SSDs at shutdown, and 4) Run the system on a UPS that can correctly shut the system down as power runs out.
We’ll cover setting up a tmpfs volume as it gives the benefits of a ramdisk and is better at working with the system to handle low memory conditions.
Setting up a tmpfs Volume
The tmpfs volume needs to be mounted on a directory like all disks. For this example, we’ll be using the directory /transactions/.
First, shut down anything that might be using that directory, and move any files that are currently there to a backup directory. Now create the tmpfs volume with:
sudo mkdir -p /transactions/
mount -t tmpfs tmpfs /transactions/ -o size=500M
Replace “500” with the maximum size you’ll need, in megabytes. For this to be available on the next boot, you’ll need to add a line to /etc/fstab:
echo 'tmpfs /transactions tmpfs defaults,size=500M 0 0' | sudo tee -a /etc/fstab
The “df -h” command will show the free space on all partitions, including this new volume:
df -h
Filesystem       Size Used Avail Use% Mounted on
...
tmpfs            500M 0 500M 0% /transactions
Now you can copy back any files or directories you’ll need to the new tmpfs volume.
Setting up a DNS Cache
The short pause between when a hostname is looked up and when its answer is available is small – in the low 10s of milliseconds. Unfortunately, this small amount of time can severely slow down a system like a mailserver that does these lookups all day long.
By creating a DNS server either on the mailserver system or on another system on the same network you can speed up these lookups as the DNS server can cache answers and hand second and subsequent answers back almost instantaneously.
I won’t go through the steps of setting one up here – there are hundreds of tutorials on setting up bind as a caching nameserver (find one for your particular flavor of Linux). When configuring it, give bind the list of machines/networks that can place queries with the “allow-query” statement.
Once you have one set up, check that it’s working by running:
dig @dns.server.ip.address www.cnn.com.
Make sure it returns an answer. Once it does, you can tell your client machines to use this DNS server by either:
- Editing your DHCP server’s settings to hand out dns.server.ip.address to DHCP clients to use first.
- On non-DHCP machines, edit /etc/resolv.conf and add the line:
nameserver dns.server.ip.address
above any other “nameserver …” lines.
Setting up an HTTP/HTTPS Squid Cache
Squid is a caching web proxy software package that’s included with many Linux distributions. Whenever a URL is requested squid keeps a copy of the downloaded file on disk; if that object is requested again, squid briefly checks with the original server to see if that object has changed, and if not, grabs the local copy instead of downloading it again.
Even though some browsers do caching on their own, this approach of having a shared cache makes a huge difference as it’s shared between all systems and all programs on those systems. On a day when two or more systems request the same downloads (think “Patch Tuesday”!), this can make a massive difference in reducing needed bandwidth.
To set up the server, install the “squid” package from your package manager. The only change you’ll need to make to /etc/squid/squid.conf is to add the following two lines just above “http_access allow localhost” (remember to run the editor under sudo, and substitute your local subnet with all your clients):
acl mylocalnet src 192.168.12.0/24
http_access allow mylocalnet
Now start it up. On any client machines, you’ll need to do one of two things to convince them to use this proxy.
- On any web browsers, go to network settings and enter “http://192.168.12.55:3128/” in both the HTTP proxy and HTTPS proxy boxes, substituting the IP address of the squid machine for 192.168.12.55 .
- On any Linux, Mac, or other Unix-line OS, edit ~/.bash_profile and add the following lines (again, substituting the IP address of the squid machine):
export http_proxy="http://192.168.12.55:3128/"
export https_proxy="http://192.168.12.55:3128/"
export ftp_proxy="http://192.168.12.55:3128/"
export gopher_proxy="http://192.168.12.55:3128/"
Once you log out and log back in again most command-line tools will honor this setting and send all web requests to the squid proxy on that system. You can watch the access log to confirm that requests are arriving successfully and being serviced by squid with:
sudo tail -f /var/log/squid/access.log
Creating Swap Space
See if you’re running short on swap space (you can see the amount available by running top, atop, or “cat /proc/swaps”:
cat /proc/swaps
Filename             Type       Size     Used   Priority
/var/swap/swap1      file      1048572  623656    -1
In this case, I’m using 623MB out of 1GB available, so I’ll add another swap space. This can be a file or disk partition (put the filename or device in the commands below) and doesn’t require a reboot.
I generally place swap files in a directory called /var/swap , but feel free to place them in a different directory, especially if you want them on a different physical disk to spread the disk load around. Please be cautious with the following commands – a typo could destroy parts of your disk. Note that since I’m already using /var/swap/swap1 I’ll create a file with a different name, /var/swap/swap2. I’ll add 512MB; adjust the “count=512” below to make the swap file the size you need:
sudo mkdir -p /var/swap/
sudo chmod 700 /var/swap/
sudo dd if=/dev/zero of=/var/swap/swap2 bs=1048576 count=512
sudo chmod 600 /var/swap/swap2
sudo mkswap /var/swap/swap2
sudo swapon /var/swap/swap2
To see the files, use:
sudo ls -Al /var/swap/
total 1572864
-rw-------. 1 root root 1073741824 Nov 29 2017 swap1
-rw-------. 1 root root 536870912 Mar 5 17:10 swap2
To see that they’re in use by the kernel:
sudo cat /proc/swaps

Filename           Type    Size    Used   Priority
/var/swap/swap1    file  1048572  623492    -1
/var/swap/swap2    file  524284     0       -2
To make this space available automatically on future boots, add the following line (with your filename or device) to /etc/fstab:
/var/swap/swap2 swap swap defaults 0 0
To stop using this as swap and get your disk space back, do the steps in reverse order:
Remove swap line from /etc/fstab
sync
sudo swapoff /var/swap/swap2
sync
cat /proc/swaps           #To confirm it's no longer in use
sudo rm /var/swap/swap2
Moving Swap Space
Ideally we never get into a situation where we’re regularly swapping – we keep adding memory until the system has enough. Unfortunately, when the system can no longer accept more ram or we cannot practically shut the system down to add it, we may need to accommodate heavy swapping. The most straightforward way to do that is to stop using a heavily loaded disk for swapping and instead use a lightly loaded disk.
Find a drive that has low disk use (or add a new one). This should be an SSD; hard drives run painfully slowly when they have to seek a lot, and reading from or writing to swap involves a lot of seeks. In this example we’ll assume it’s mounted on “/newspace/” – adjust the following instructions to match the path of your drive.
With commands similar to the previous section, make a “swap” directory somewhere on that disk and make it owned by root.root and mode 700; this keeps normal users from being able to get to the files inside. Make a new swap file, format it for swap, and activate it (again, commands similar to the above section). FInally, add a line to /etc/fstab to make it available on future boots.
sudo mkdir -p /newspace/swap/
sudo chmod 700 /newspace/swap/
sudo dd if=/dev/zero of=/newspace/swap/swap3 bs=1048576 count=512
sudo chmod 600 /newspace/swap/swap3
sudo mkswap /newspace/swap/swap3
sudo swapon /newspace/swap/swap3
echo '/newspace/swap/swap2 swap swap defaults 0 0' | sudo tee -a /etc/fstab
Once you checked that the new swap space is active, now you can consider deactivating any swap files or partitions on existing drives. First, check the names of the swap files/partitions:
sudo cat /proc/swaps

Filename               Type     Size     Used   Priority
/var/swap/swap1        file   1048572   623492   -1
/newspace/swap/swap2   file   524284      0      -2
If I want to stop using /var/swap/swap1 because it’s on a heavily used disk:
Remove swap1 line from /etc/fstab
sync
sudo swapoff /var/swap/swap1
sync
cat /proc/swaps           #To confirm it's no longer in use
Note that when you run swapoff on /var/swap/swap1, if there are blocks still swapped out there they’ll be pulled back in automatically. This can take a few seconds to a few minutes depending on system load and the amount of swapped data, and the system may feel sluggish because of all the disk activity.
Once you’ve finished creating a new swap space and removing the old one, your system can use the initial disk for just data and programs – all of the swap activity will happen on the new/lightly loaded disk. Also, you don’t need to worry about having two or more disks with simultaneous heavy disk activity; current Linux kernels handle this extremely efficiently.
If I’m sure I no longer need it, I can remove the original swap file with:
sudo rm /var/swap/swap1
Moving ext4 Journal
Linux’ ext3 and ext4 filesystems include a journal, a space inside the filesystem where all writes go at first, back to back. Since this space is contiguous, the writes happen very quickly. After a small delay, and hopefully when the disk is quieter, these writes are then copied to their final destination in the filesystem.
There are two advantages to this; it not only makes it significantly easier to make sure the drive is never in an inconsistent state, helping to avoid long filesystem checks, but also allows a long burst of writes without accompanying seeks. The downside is that everything needs to get written to that disk twice.
There’s a workaround; place the journal on a separate drive. This still requires all writes to be written twice, but now the writes are to a separate disk, so we recover most of the speed lost in having a journal.
There are a number of posts on how to do this; here is a relatively straightforward one. Note that this is best done when creating the filesystem, as opposed to moving the journal later (this is tricky and may require booting from an external flash drive).
Benchmarks: https://raid6.com.au/posts/fs_ext4_external_journal/
Note: this only applies to writes on ext3 and ext4 filesystems. Reads are totally unaffected by any journal settings or placement.
Using ionice to Prioritize Disk Traffic
By running a program under “nice”, like:
nice MyBackupProgram
we tell the Linux kernel to reduce this program’s priority; it effectively gives all the other programs on the system first use of the available processor time and lets MyBackupProgram use the CPU time that’s leftover when the others have had their fill.
As a side note, by using “nice -NN” (a negative number), we can give a program higher priority – it gets first access to the processor, ahead of everything else on the system:
nice -15 MyCdBurner
Linux extends this to disk activity as well. By using “ionice”, we can instruct the kernel to lower or raise this program’s disk priority in much the same way we did with processor priority above.
To lower disk priority, giving all other programs access to the disk first, use:
ionice -c3 MyBackupProgram
To raise disk priority, so other programs have to wait to access that disk until this one is done:
sudo ionice -c1 MyCdBurner
You can actually get a little more fine-grained than that; see “man ionice”.
With both nice and ionice, we have to pay attention to what happens if the adjustment causes the program in question – or some other unrelated program – gets starved for CPU time or disk access. For example, MyBackupProgram could get so little CPU time or disk bandwidth that instead of taking 45 minutes to back up the system, take 34 hours. If this were run from cron, we could actually end up having multiple backup tools running at once, which causes them to run even slower!
Note that ionice is available on Linux but not on BSD Unix, Windows, or MacOS (though “nice” is available for all of them). You may need sudo privileges to run things under ionice, especially if you’re trying to raise disk priority.
Changing Mounts to Relatime
On old linux systems every time a file was read the kernel would update the “Accessed” timestamp so that you could later come back and ask “when was this file last read?”. On systems with large numbers of small files – especially ones where you’d scan a large tree of them looking for content – this could cause a massive number of writes. Filesystems where this happens are mounted with the “atime” option.
One way to eliminate these writes is with the “noatime” option; filesystems mounted with this option will never update the “Accessed” timestamp when a file is read. This can occasionally cause problems with some programs, commonly mail readers and backup tools.
The better way to minimize the number of writes is to use “relatime”. When mounted this way, reading a file will update the “Accessed” timestamp once after it is written. This keeps the number of writes down significantly while keeping mail readers and backup programs happy.
Run:
mount | less
then type “/atime” without the quotes. This will search for, and highlight, the “atime” mount options. If any of them still list “atime” as one of their mount options (say, the “/mnt/external1tb” drive below:
...
/dev/sdd1 on /mnt/external1tb type ext4 (rw,atime)
...
then switch it over to relatime with:
sudo mount -o remount,relatime /mnt/external1tb/
Make sure you edit the line in /etc/fstab for that mount to change the option to relatime as well for future boots.
I’m Short of…
Processor Power
- See if your primary CPU user can be configured to use more than one processor. For example, the bzip2 file compressor has a sister program, pbzip2, that performs the same task of compressing a file but does it in parallel on multiple processor cores. Search in the program’s documentation for “multiprocessing” or “multiple processors”.
- See if the work you need to perform can be broken up into smaller chunks that can be independently performed by multiple copies of the same program.
- Consider replacing older, slower systems with ones that have faster processors or larger CPU caches.
- Make sure the CPU is adequately cooled – an overloaded/overheating processor can be damaged (worst case) or slow down until cooler (best case).
Disk Capacity
- If you have extra processor time, compress files before saving to disk
- Limit the size of, or totally remove, any cache files or directories on disk.
- Uninstall any unneeded programs
- Delete old/unneeded temporary files
- Add another disk to the system and move files onto it.
- Delete old/unneeded docker images
- Delete old/unneeded virtual machine images and snapshots
- If your system uses LVM to manage pools of disk space (Centos and RHEL Linux tend to do this by default) and has unused capacity, allocate more space to the partition that’s close to full.
- Move files to a file share/NAS or different system and mount them if needed. This is best for files that are:
- Little-used or accessed
- Unlikely to change,
- Larger
- Older
- Data files and archives
, and poor for files that are: - Heavily used
- Recently modified
- Small
- Executables or system libraries
- Link identical copies of files together. See the “hardlink” and “freedups” utilities.
Network Bandwidth
- If you have extra processor time, compress files before sending/receiving
- When transferring files on/off system, limit the amount of bandwidth used for the transfer, which makes the transfer take proportionally longer but keeps more bandwidth free for other programs. The “rsync” file transfer program has a “–bwlimit=NNNN” parameter, where NNNN is the maximum amount of bandwidth to use in Kilobytes/second. The “curl” http download tool has “–limit-rate MMMM”, where MMMM is in bytes (unless followed by “K”, “M”, or “G”).
- Download files ahead of when they might be needed, when network access is lighter.
- Use a DNS or HTTP cache on your end of the slow link and direct your client machines to prefer it over going direct to servers on the internet.
Memory
- Turn off unneeded programs
- Remove any unneeded kernel modules
- If any executables have been recently updated as part of system patching, restart them by hand or restart the system to make sure there’s only a single version of that executable running. (2 different versions of the same program running at the same time will not share memory as well as a single version).
Additional Notes
Raid
Don’t use Raid 0 (striping by itself) or LVM (Logical Volume Management) because that lowers your mean time between failures.
RAID 4, 5, and 6 do provide some redundancy and can continue to function with 1 (RAID 4 and 5) or 2 (RAID 6) dead drives (with a lower cost/usable megabyte than RAID 1). However, the performance loss on writes is terrible and may very well be the bottleneck in an otherwise well-functioning system. Buy the extra storage and go with RAID 1, RAID 10, or btrfs. Trust me.
USB connection
With USB disks or network adapters, it’s actually possible that the connection you have to the system could be the bottleneck, not the device itself. As we saw above, the test USB 3.0 drive was able to stream 190MB/s to the host system. If we plugged that into a USB 2.0 port, it would work, but all transfers – reads and writes – would be limited to 60MB/s (the transfer limit for USB 2.0). If 2 or more devices share a USB 2.0 hub, the combined bandwidth of all devices on that hub would be 60MB/s. Plug any hard drive into a USB 1.0 port, and the host system will hang for multiple seconds as it takes so long to perform any transfer at 1.5MB/s.
In short, make sure you have a fast enough connection type to accommodate all the data that needs to pass through. USB 3.0 (625 MB/s), USB 3.1 (1,250 MB/s), and USB 3.2 (2,500 MB/s) should be fine for multiple disks, but do the math for the devices in question.
(Wikipedia USB article)

Bill has authored numerous articles and tools for client use. He also serves as a content author and faculty member at the SANS Institute, teaching the Linux System Administration, Perimeter Protection, Securing Linux and Unix, and Intrusion Detection tracks. Bill’s background is in network and operating system security; he was the chief architect of one commercial and two open source firewalls and is an active contributor to multiple projects in the Linux development effort. Bill’s articles and tools can be found in online journals and at http://www.stearns.org.