Improving Packet Capture Performance – 3 of 3
Intro
Packet capture tools regularly have problems with performance. The three tasks of reading packets from network interfaces, doing any needed processing, and sending results to disk/screen may seem like tame things to do, but they’re asked to do this to millions of packets per second.
We want to share some of the most common techniques that help packet capture programs keep up with the load. To illustrate them, we’ll show how to actually use these techniques with 3 common packet capture tools; Tcpdump, Zeek, and Wireshark.
Output
Limit What’s Written to Disk
Disk writes are one of the slowest things a computer can do; even when all the sectors to be written are contiguous, one still has a limit on how fast things can be placed on disk. Unfortunately writes are almost never totally contiguous. Hard drive seeks slow things down even more (see this past blog post, specifically the sections on disk speed and access).
In the worst-case scenario, your sniffer can ask to write a log entry or file to disk and be blocked from doing any other task until that write is complete. This can lead to horrendous packet loss when disk writes are heavy. In the best case, the sniffer can send the disk write to the operating system and continue with its work, but this, too, can cause problems when there are a large number of writes queued up and that buffer fills up.
Look at all the files your sniffer writes. Do you need them? If not, see if there’s a command-line or configuration option to disable these writes.
tcpdump
tcpdump only writes to disk when the “-w” command-line option is requested.
If you do need to save some packets but do not want to save them all, use a filter on the command line to limit what is saved to disk:
tcpdump -i eth0 -qtnp -w tcp_443.pcap 'tcp port 443'
Zeek
Zeek doesn’t save captured packets to disk. Once it has done its processing it saves summary lines with information about specific connections to its collection of log files, but not the raw packets from that connection. While this means it usually makes heavier use of the processors, it also means it uses less disk bandwidth overall than other tools that save the entire packet.
Wireshark
When capturing packets Wireshark saves them to disk by default (if you don’t specify a filename, Wireshark saves them in a temporary file). It doesn’t appear possible to stop saving to a file, so the best approach is to use a capture filter as we described in Blog 1 to limit the packets that are both captured and saved to disk.
Limit What’s Written to the Screen
While it’s not as critical as the techniques above, it’s worth considering the amount of processor time needed to simply display packet summaries.
The worst offenders are graphical applications that show a summary for each packet; doing that requires the efforts of multiple libraries and your graphical desktop software. This can be a significant load.
If you switch to a sniffer that has textual output and show it in a graphical desktop terminal, this will reduce the amount of processing for each line. For example, instead of using the graphical Wireshark sniffer, use the text-mode equivalent called “tshark”.
To reduce the processing even more, run that text-mode sniffer right on the Linux console with no graphical desktop at all. This sends the lines of text right to the screen with far fewer libraries needed to do the display.
Using “Screen” to Hold Program Output
When using a text-mode sniffer (either in a graphical desktop or on the console) you have one more trick for handling high-speed output; the “screen” utility. Think of “screen” as a tool that makes a fake console to which your sniffer writes its output. At any point you can switch between “show me the output from this program” and “hide the output, I don’t want to see it, but keep capturing it so I can connect at any point in the future and see it again”. In this second mode, the screen program is collecting the program output at extremely high speed, and is likely running far faster than it could have run even on the console.
Here’s an example of running a sniffer inside screen to make it faster. First, we make a fake console named “capture” so we can easily find it and reconnect later:
screen -S capture -R
Running this only gives you a new command prompt with almost no clues that anything has changed. In this new command prompt, run your sniffer program and you’ll see the output show up like normal:
tcpdump -i eth0 -qtnp
Now the magic: press “ctrl-a”, then “d”. This disconnects you from the screen session and returns you to your original prompt. If you take a look at the list of running processes with “ps axf”, you’ll see screen still running. Here’s an example on my system:
…
28706 ? Ss 0:00 SCREEN -S capture -R
28707 pts/19 Ss 0:00 \_ /bin/bash
28755 pts/19 S+ 0:00 \_ tcpdump -i eth0 -qtnp
...
tcpdump is still running in the background and handing its output to the screen program, though that output is never actually making it to any physical display.
To reconnect to that window and see where tcpdump is now, run
screen -S capture -R
again and you’ll be watching tcpdump live once more. You can disconnect and reconnect as frequently as you’d like and tcpdump will just keep running.
We have a blog post with more details about how screen can be used: See Here
tcpdump
Running tcpdump inside “screen” to capture the output and only view it when you need it is probably the most straightforward way to get all the output with very little cost. That said, you can always run tcpdump with one or more of the following to reduce the cost of screen output:
-q
Use “quiet” mode to reduce both the amount of processing on each packet and the amount written to the screen.
>/dev/null
Throw away the output lines, leaving just error messages and the summary at the end. Note that if you’re saving packets to a file with tcpdump (“-w savefile.pcap”), tcpdump won’t show individual packet detail lines anyways.
Zeek
Zeek is run in the background and doesn’t provide direct output to screen (any information it generates is saved in its log files).
Wireshark
Disable “Update list of packets in real-time”, “Automatically scroll during live capture”, and “Show capture information during live capture” while doing captures. You want wireshark focused on the capture, not updating the screen, while under heavy load. All three of these are found in the Capture, Options, Options tab:
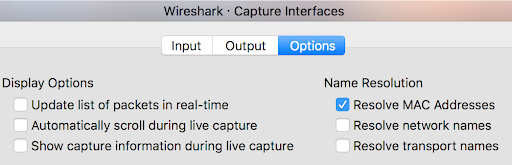
General
Turn off Unneeded Processes on the Capture System
Since this is such a time-sensitive task, we want to make sure the sniffer isn’t interrupted or delayed by other programs running on the same computer. If you have other tasks that could make heavy use of the processors, memory, network, or disk, migrate them off to a different machine if possible.
We cover more of this in our previous blog “Why Is My Program Running Slow“
Process Priority
Linux, Unix, and Mac systems have the concept of running a program under a tool called nice, such as executing nice top . This starts up the top program that shows what programs are running, but it tells the kernel to “run this, but make sure all other programs get processor time first, then give anything left over to top”. On a system with more CPU need than available CPU, the other tasks get more processing time, and top may be slowed down some.
One thing that isn’t immediately clear is that the nice tool can do the opposite – it can tell the kernel “make sure this program gets first access to the processor, and if needed, give less processor time to the other programs to allow that.” To use this mode, run it like this:
sudo nice -n -10 top
Because this is asking the operating system to give higher priority to our program, we have to prove we have the right to do so, and like so many other things on Linux and Unix platforms, that means running it as root using sudo . Now top will be able to run first, potentially starving other programs of CPU time.
This technique is particularly important for running packet sniffers; we want to give them first priority to the processor so they can quickly respond to incoming packets and handle them. That may mean that other programs running on the system will run more slowly, but we don’t normally care if the other programs take a few seconds longer to complete.
It’s worth understanding a little more about the “nice” level. Nice levels run from +19 (meaning run this at really low priority letting everyone else go first) to -20 (meaning this program should get very high priority and everyone else should wait). A program started without using the nice program at all has a nice level of 0, right in the middle of the range. If you use nice but don’t specify a nice level you get +10 by default; the program gets slightly lower priority. When running a program like a packet filter that really needs first access to the processor, we commonly choose -20 so everything else is held up if our packet sniffer needs CPU time (when you do this, be aware that even logging in can take longer!).
Once you’ve adjusted the process priority of a program you can see the new setting by running top. The nice level will be shown in the column with “NI” at the top.
tcpdump
Since tcpdump is started at the command line, we can start at a high processor priority with:
sudo nice -n -20 tcpdump ...
Zeek
Because Zeek is usually started in the background by one of the scripts used to start the system and is commonly started indirectly by broctl , there’s no immediately obvious way to force Zeek to run at higher CPU priority. The good news is that we can change the nice level after it has started with the renice command. Run this after the system boots, when Zeek is restarted, or from cron every hour:
sudo renice -n -20 -p `pidof bro` `pidof zeek`
Wireshark
If you start Wireshark from the command prompt, you can absolutely run it under nice :
sudo nice -n -10 wireshark
If you start it from a menu, though, you won’t have a chance to change the priority. In that case, start Wireshark, open a new terminal, and run:
sudo renice -n -20 -p `pidof Wireshark` `pidof wireshark`
IO Priority
The nice (and renice) commands above do a good job at tagging individual processes to have either raised CPU priority (because they have to respond as quickly as possible like our packet sniffers) or lowered CPU priority (for programs that can wait a bit). One of the Linux kernel developers also noticed it would be possible to raise or lower disk priority in a similar way.
To see why this would be useful, imagine that a Linux system is sniffing packets and writing them to disk when a backup program starts. The backup tool has very little CPU time needed; instead it spends almost all the time reading from disk (as well as writing to another disk or the network). It’s quite possible that all that disk activity from the backup program could pause the sniffer repeatedly as the sniffer attempts to write blocks of data to disk, and this could contribute to lost packets.
The most elegant way to handle this comes from the ionice utility, which changes disk priority instead of CPU priority. We have a few choices; raise the disk priority of the sniffer:
sudo ionice -c Realtime tcpdump -w /packets.pcap
, lower the disk priority of the backup program:
ionice -c Idle -p `pidof backup_program_name`
, or both:
sudo ionice -c Realtime tcpdump -w /packets.pcap
ionice -c Idle -p `pidof backup_program_name`
There are 2 effects of doing this: 1) our packet capture tool won’t get paused because there’s too much disk reading or writing going on, and 2) the backup will likely take longer because it will get paused if the disk is tied up writing packets.
Much like top: 1) you can start a fresh command-line program like we did with tcpdump or 2) you can modify the disk priority of a running program with the “-p” command line parameter. Also, if you are raising disk priority to give a program first access to the disk over all others, you’ll need to run ionice under sudo.
tcpdump
Since tcpdump is usually started at a command line, we can directly assign disk priority:
sudo ionice -c Realtime tcpdump -w ~/packets.pcap ...
Zeek
Since Zeek is usually run from boot scripts or broctl, we’ll have to modify the disk priority of already running processes:
sudo ionice -c Realtime -p `pidof bro` `pidof zeek`
Wireshark
If you start wireshark from the command prompt, you can absolutely run it under ionice:
sudo ionice -c Realtime wireshark
If you start it from a menu, though, you won’t have a chance to change the priority. In that case, start Wireshark, open a new terminal, and run:
sudo ionice -c Realtime -p `pidof Wireshark` `pidof wireshark`
Dedicated Data Drive
In the previous section, we looked at how to prioritize disk reads. We did assume that the two programs fighting over disk access were both trying to work with the same disk.
There’s another way to address this – move the packet data to a different disk! By doing this we use the Linux kernel’s ability to have simultaneous disk access to multiple drives without conflict.
To use this approach you’ll need to add a dedicated disk for packet capture files. I’d strongly recommend using an SSD; there are some significant performance benefits to these over regular rotating media hard drives. Once you’ve installed it, formatted it, and mounted it at the directory where your logs will go, not only have you expanded the total disk space but you’ve also neatly stepped around most fights over disk access. (Note that you’ll want to 1) tell your backup program to not backup your packet capture disk, or 2) continue to use the ionice program as we discussed in “IO Priority” above.)
Split Capture and Processing to Two or More Machines
In many of the sections in this blog series we’ve treated “packet capturing and analysis” as a process that’s performed by a single program running on a single machine where packet capture and packet analysis are done at the same time. Let’s drop that mindset.
First: Capture packets with the best tool for that job. Pick a lightweight packet capture program that will do little or no processing of the capture packets. Run that tool at high CPU and disk priority on a system that’s doing little else. Use a BPF to limit the capture to just the packets you need, and save those to disk. tcpdump can perform this part quite well, though you’re welcome to use any lightweight tool you’d like.
Second: Set up one or more different computers that will perform the analysis you want. These can be physical machines, virtual machines, cloud servers, or any other processing platform. You’ll want some way to organize the effort so that only a single analysis box performs the processing for a pcap file, but this could be as simple as moving files around on a network file share.
Third: Transfer the packets to either a second system that will perform all the analysis, or to the shared network drive that all the analysis systems can see. Note that you’ll want to run this transfer at low CPU and disk priority. Also, make sure that this transfer happens on a different network segment than the one you’re sniffing!
The analysis systems can run any tool that can read pcap files, and that’s the majority of them. As packet loads go up you’ll have the option of bringing in more physical machines for analysis or renting time on cloud servers if you feel the spike in traffic is temporary. If you’re using primarily physical computers, you may want to consider running the analysis in virtual machines on them. This allows you to clone the virtual machines and share CPU and memory.
Wireshark
Have a lighter-weight program like tcpdump do the packet capture and save the packets to disk, then have Wireshark display and process them later.
Choice of Operating System
While we all have our favorite operating system based on the User Interface and our preferred applications, the primary concern in packet capture performance is the speed of the operating system kernel in capturing packets. If you ran the same sniffer on separate operating systems under heavy load and measured the packet loss, you’d see the least packet loss on Linux, similar packet loss on Mac OS and BSD, and significantly higher packet loss on Windows.
As discussed above, the Linux kernel can actually process packets using multiple processor cores, spreading out the load and letting it handle more packets per second. The Cloudflare blog “How to receive a million packets” (see References) discusses how this is accomplished at a very low level.
References
Sans provides excellent references to the IPv4 and IPv6 packet structure:
– https://www.sans.org/security-resources/tcpip.pdf
– https://www.sans.org/security-resources/ipv6_tcpip_pocketguide.pdf
For more information on the BPF language, see:
– https://biot.com/capstats/bpf.html
– https://www.ibm.com/support/knowledgecenter/SS42VS_7.4/com.ibm.qradar.doc/c_forensics_bpf.html
General notes on system performance:
– https://www.activecountermeasures.com/why-is-my-program-running-slowly/
Specific notes on how the Linux kernel handles packet scheduling:
– https://blog.cloudflare.com/how-to-receive-a-million-packets/
Tools and libraries:
- Libpcap: www.tcpdump.org
- Winpcap: www.winpcap.org
- Npcap: nmap.org/npcap
- List of pcap applications: http://www.stearns.org/doc/pcap-apps.html
Thanks
Special thanks to Shelby for making this presentable, Keith for reviewing the text, and Sam for all his capture testing (we included many of his techniques in this blog).
This blog is #3 in a series of 3.
#1 – Measuring the Problem
#2 – Processing
Bill has authored numerous articles and tools for client use. He also serves as a content author and faculty member at the SANS Institute, teaching the Linux System Administration, Perimeter Protection, Securing Linux and Unix, and Intrusion Detection tracks. Bill’s background is in network and operating system security; he was the chief architect of one commercial and two open source firewalls and is an active contributor to multiple projects in the Linux development effort. Bill’s articles and tools can be found in online journals and at http://www.stearns.org.