Packet Loss, or “Why Is My Sniffer Dropping Packets?”
Intro
When I run a sniffer on a network, I assume I’m going to see all packets on that network. This is rarely the case. 🙂
Packet loss is a topic that comes up frequently when talking about capturing and analyzing packets from a network. In this blog we’ll look at what it is, why it exists, and what you can do to minimize it.
In our example we’re running Zeek (source code), an open source packet capture and analysis program that runs on Linux and MacOS. While we may occasionally refer to Zeek in our “potential fixes” section, the general concepts and approaches we discuss should apply to any packet capture software running on any platform.
What Is Packet Capture?
The overall goal of a packet capture tool is usually to listen to all the packets flying by on a network, grab a copy of each of these, and analyze them (or sometimes just save them to disk). There are a few things we need to consider:
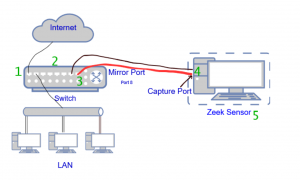
- Switches don’t want to give you all their packets. By default, a device plugged into a switch only gets the packets destined for that device (along with multicast and broadcast packets). That means we can’t take a capture program, plug it into any port on a switch, and see the traffic for everyone else too.
- To get around that, managed switches will commonly allow you to set one of the ports as a mirror¹ port which gets all packets heading to or from one of the other ports (called the monitored port). You have to configure this in the management interface on the switch. Once configured, we place an Ethernet cable from that specific port to the capture port on our Zeek sensor – the red line in the diagram above – and now we get to see all of the traffic to and from the monitored port.
- Unmanaged switches cannot do this – they lack the management interface needed to configure mirroring. In order to capture traffic, upgrade the switch where you need mirroring to be a managed switch (most will include port mirroring, but check the specs for a reference to “mirror”, “span”, or “copy”.)
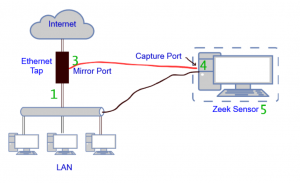
- In the case where we can’t set up a switch in this way, it may be possible to use a network tap instead. If you want to capture all packets flowing over an ethernet cable, picture cutting it with a pair of scissors and plugging the cut ends into a device called a tap. That device has one or two additional ethernet ports that will send copies of all packets to one or two capture ports. Here’s the single port approach:
What Is Packet Loss?
Ideally, we would get all packets going to or from the monitored port on the switch – that would be 0% packet loss, and if that always happened you wouldn’t need to read this blog. 🙂
In the real world, it’s very common that somewhere between the ethernet cable that brings packets into your switch and the running program that’s analyzing the copies, some percentage of those packets will never be analyzed because of packet loss.
What Causes Packet Loss?
Here are the 5 major reasons why we lose packets in capture. The numbers for these correspond to the green numbers on the two diagrams above.
- Your switch is only seeing one direction of capture. If your outbound traffic heads out to one ISP, but the response packets come back through another, a given switch may only see one side of the conversation. Depending on where you do your capture, this may have the effect of only capturing the packets in a single direction.
- The switch is overloaded. When this happens, the switch has to decide how it will use its (limited) processor. The first priority is to send packets to their original destination; sending a copy of these to the mirror port is definitely a secondary goal. That’s why a heavily loaded switch may not send everything through to the mirror port.
- The monitored port on a gigabit switch could have as much as 1Gb/s flowing outbound and have 1Gb/s coming inbound. When the switch is asked to copy all this traffic out the mirror port, it can’t – you can’t stuff 2Gb/s out through a 1Gb/s mirror port. The switch has no choice but to discard some of the traffic. See this blog for more details.
- The “Hardware offload” features on the capture port screw up the capture. Higher-end network cards include additional features that handle some of the packet processing on the card itself rather than depending on the main processor to do it all. Normally this helps, but when you’re capturing packets this commonly hurts.
- Your capture tool is too slow. As it’s processing one packet new packets show up and get added to a buffer in the operating system kernel. When the packet buffer fills up the kernel has no choice but to overwrite some un-analyzed packets with new ones. The overwritten packets are reported when the capture session is closed. Only this one issue shows up as capture loss in libpcap’s statistics.
If you look carefully at the second (tap) diagram, you’ll see it doesn’t have a “2” – that’s because a tap should always have enough processing power to copy packets over to the mirror port(s).
If your tap has a single mirror port, it technically could run into problem 3 (stuffing 2Gb/second of traffic through a 1Gbps transmit port.) More expensive taps commonly have 2 output ports, one for each direction of packet flow. That arrangement will not have problem 3.
What Else Can Happen That Makes Packet Loss Spike?
- Simultaneous backups of large numbers of systems
- Other large (commonly scheduled) data transfers
- A DDOS against one or more servers
- Any other network flood. One thing to check for is a network scanner that’s misconfigured to send packets as quickly as possible.
- A rise in packet traffic that your capture tool wants to inspect more deeply. For example, you might have a lightly loaded web server you monitor. Most of the traffic is HTTP and that’s easily handled, but for the occasional HTTPS connection you decrypt the traffic (as you have the TLS key). If that server started getting a huge amount of HTTPS traffic in an attack, your processing time per packet would skyrocket.
- System memory, CPU, or disk on the analysis system are taken by other processes (see This Blog Post )
The above spikes can be triggered by either malicious or benign traffic.
How Can I Detect That It’s Happening?
- Libpcap packet loss statistics. Some packet capture programs will print packet loss statistics automatically when they exit. This only reports on problem 5, where the libpcap library senses that packets got all the way to the system kernel, but weren’t processed because the capture program couldn’t keep up.
- Zeek’s capture_loss.log .
#fields ts ts_delta peer gaps acks percent_lost
#types time interval string count count double
1655482106.949246 900.000066 worker-1-1 0 163423 0.0
1655482106.955215 900.000081 worker-1-3 0 163423 0.0
1655482107.282526 900.000083 worker-1-2 0 163437 0.0
Zeek can detect gaps in TCP conversations by looking for missing packets in the middle of the stream. Based on this it can report on the approximate percentage of packet loss every 15 minutes. Since TCP traffic is around 90% of what is seen on the network this is a reasonable measure for overall packet loss.
By measuring the TCP gaps Zeek can see packet loss for any of the 5 reasons we mentioned above, not just packets that were dropped by libpcap.
At the end of each hour, this file is compressed and saved to the same dated directories as the rest of the Zeek logs, so you can look back at those files to see when spikes have occurred over a 24 hour period:
/opt/bro/logs/2021-06-01# zgrep '^[^#]' capture_loss*.log.gz | awk '$6 > 0.0'

capture_loss.17:00:00-18:00:00.log.gz:1622569857.145252   900.000156 worker-1-2   3 118154 0.002539
capture_loss.18:00:00-19:00:00.log.gz:1622572557.145432   900.000012 worker-1-2   4 146435 0.002732
capture_loss.19:00:00-20:00:00.log.gz:1622575257.145562   900.000083 worker-1-2   8 202811 0.003945
capture_loss.19:00:00-20:00:00.log.gz:1622576157.145717   900.000155 worker-1-2   1 173211 0.000577
While there is some packet loss here, these example lines all report under 1/100th of a percent of loss.
- You notice that your list of analyzed connections doesn’t include some traffic that it should.
- A managed switch will be able to give port details on how many packets were discarded. A high number here may indicate an overloaded switch or other network problem.
- Switch statistics may also show a spike in traffic on one or more ports. This won’t directly tell you that packet loss is occurring but may point you at one of the systems involved in a network flood that contributes to packet loss.
No matter which approach you use to detect packet loss, make sure you look through an entire day. A capture program that is able to keep up quite well overnight might start to lose packets as the network load goes up when people arrive for work. Similarly, the capture program does just fine during the workday but starts to miss huge numbers of packets when 75 system backups all start at 2am.
How Does It Affect the Packet Capture Tool?
In all 5 of the above problems, the end result is that the capture and analysis program never does the processing on the missing packets.
It’s a little like trying to read a long book where you get to certain pages that are blank. Could you still figure out what’s happening? Probably, if the number of blank pages were small compared to the length of the book. If you were missing up to, say, 3% of the pages you could still follow along by using your imagination. 🙂 If 5-20% of the pages were blank, you might totally miss parts of the story. If over 50% of the pages were missing, it would basically be hopeless to understand what’s going on.
Even though there are no fixed percentages for “how much packet loss is acceptable”, here are some general guidelines:
- Less than 2%-4% packet loss: the analysis will probably be fine, with occasional gaps
- 5%-10% packet loss: worth investigating when time allows
- 15% or more packet loss: your analysis will start to suffer – worth investigating as soon as practical
- Approximately 50% packet loss: this may be a sign of 2 potential problems. a) Your switch is only seeing one direction of packets. See if your network has outbound packets heading through one switch and inbound packets coming through a different switch. b) The network interface used to capture packets on the capture system has one or more offloading features turned on. Both of these issues tend to exhibit themselves as between 40 and 60 percent packet loss in Zeek.
Does the Tool Care?
So this is an interesting question that can only be answered with knowledge about why you’re capturing the packets in the first place.
If you need a perfect copy of all traffic flowing in and out of your network for archive, forensics, auditing, or legal purposes, even a small amount of packet loss would be unacceptable.
If the capture tool is looking for general patterns, like a) general network traffic statistics, b) identifying traffic types, or c) looking for live systems and their characteristics, you may not need to see everything. Those tasks can still be performed even when a small percentage of the traffic is not analyzed.
What Can We Do to Minimize It?
- If you are only seeing one direction of the packets:
- Capture the other direction and analyze that too on the same capture system and capture tool
- If your switch is overloaded and failing to make second copy to the mirror port:
- See if your switch is unable to keep up with the combined traffic flow from all ports. This can be done with SNMP or a good network monitoring tool. Lawrence Popa has an excellent article on switch “backplane throughput” at https://www.auvik.com/franklyit/blog/backplane-throughput/ .
- Switch to using taps instead of mirror ports on switches.
- Spread the load out to multiple switches.
- If the mirror port can’t handle the combined traffic in both directions:
- Change to a switch with a mirror port that’s at least twice as fast as the port you’re monitoring (such as using a 5Gbps mirror port to watch a 2.5Gbps network interface). The capture port on the capture system will need to be that same speed (5Gbps in our example).
- Switch to 2 taps and capture on 2 ports.
- If the hardware offload on the capture ethernet port screws up the capture:
- On Linux, disable hardware offload features. Running the following commands against your packet capture interface should handle this. (Make sure you run them after each reboot):
ethtool -K interface tso off
ethtool -K interface rx off
ethtool -K interface tx off
ethtool -K interface sg off
ethtool -K interface tso off
ethtool -K interface ufo off
ethtool -K interface gso off
ethtool -K interface gro off
ethtool -K interface lro off
- On Linux, disable hardware offload features. Running the following commands against your packet capture interface should handle this. (Make sure you run them after each reboot):
- If the packet capture tool can’t keep up
- Reduce processing on each packet
- Disable deep processing of the payload
- Disable all analysis modules you do not need or schedule them for later by running a different program on captured pcap files
- Ignore high-volume traffic flows
- See “Filtering packets with BPF“, below
- For AC-Hunter and RITA in particular, these tools do not need to analyze traffic from any internal systems to any other internal systems. By putting in a BPF to ignore this traffic you drastically reduce the capture load on your Zeek sensors, and correspondingly reduce the load on RITA and AC-Hunter.
- If the bottleneck is the disk
- Reduce the traffic stored to disk. For example, would your future analysis needs be met if we stored the opening and closing packets of a TCP connection, but not all the packets in between? If so, see “Dropping Payload Packets” in https://www.activecountermeasures.com/filtering-out-high-volume-traffic/.
- Get faster disks. This could include switching to SSDs and/or using a RAID array (like RAID 0 or RAID 10, but not RAID 5 or RAID 6).
- Configure the capture program to use more than one processor
- Use a faster CPU and memory
- If you’re analyzing traffic with an appliance, see if your vendor offers one with more processing power.
- Split a single flow of packets into multiple flows to multiple sensors
- F5 offers commercial products that splits a flow of packets into multiple flows that can be sent to multiple packet capture boxes. For open-source alternatives, see this article.
- Reduce processing on each packet
There’s one more approach to consider. If it’s not practical to do the analysis on live packets, you might consider just saving packets to disk instead of analyzing them live. These packet capture (aka “pcap”) files can be analyzed later on a different system or even a cluster of similar systems. Keeping up with a faster flow of packets then turns into adding more analysis systems to the cluster. Note that this approach can mean writing huge amounts of data to disk, so make sure your storage can keep up.
References
Overview of packet capture concepts and practices
https://www.youtube.com/watch?v=9fSBT_0lO4c
https://www.youtube.com/watch?v=t7bhnK47Ygo
Problem of trying to send too many packets/second through the span port
https://www.activecountermeasures.com/why-you-cant-monitor-a-1-gb-connection-with-a-1-gb-span-port/
Capturing in a cloud environment
https://www.activecountermeasures.com/cloud-network-and-virtual-machine-monitoring/
Capturing in Amazon’s AWS
https://www.activecountermeasures.com/aws-vpc-traffic-mirroring/
https://www.youtube.com/watch?v=cGV2R-9C9EY
Capturing in Azure (specific to AC-Hunter)
https://www.activecountermeasures.com/threat-hunting-in-azure-with-ac-hunter/
https://www.youtube.com/watch?v=sVpclJ4jOZg
Filtering packets with BPF
https://www.youtube.com/watch?v=H1azxPjDdYY
https://www.activecountermeasures.com/filtering-out-high-volume-traffic/
https://www.activecountermeasures.com/building-a-global-ignore-filter/
General topics on speeding up packet capture
https://www.activecountermeasures.com/improving-packet-capture-performance-1-of-3/
https://www.activecountermeasures.com/improving-packet-capture-performance-2-of-3/
https://www.activecountermeasures.com/improving-packet-capture-performance-3-of-3/
General reference to performance problems
https://www.activecountermeasures.com/why-is-my-program-running-slowly/
Packet analysis concepts and techniques
https://www.antisyphontraining.com/getting-started-in-packet-decoding-w-chris-brenton/
https://www.antisyphontraining.com/network-forensics-hunting-with-packets-w-jonathan-ham/
More on disabling hardware offload
https://blog.securityonion.net/2011/10/when-is-full-packet-capture-not-full.html
Background and explanation of switch backplane capacity (it explains why a 12 port gigabit switch may not be able to handle 12 gigabits of traffic when all ports are fully loaded.)
https://www.auvik.com/franklyit/blog/backplane-throughput/
Credits
Many thanks to Chris Brenton for his review and all he’s shared about network design and packet capture. Thank you to David Quartarolo for creating the network diagrams and his suggestions. Thank you also to Shelby Perry and Keith Chew for their help in publishing this.
¹ Depending on the vendor, this can be called a copy or span port – we’ll use the terms interchangeably.
Bill has authored numerous articles and tools for client use. He also serves as a content author and faculty member at the SANS Institute, teaching the Linux System Administration, Perimeter Protection, Securing Linux and Unix, and Intrusion Detection tracks. Bill’s background is in network and operating system security; he was the chief architect of one commercial and two open source firewalls and is an active contributor to multiple projects in the Linux development effort. Bill’s articles and tools can be found in online journals and at http://www.stearns.org.