Identifying Long Connections with Bro/Zeek

Bro/Zeek is an awesome tool for documenting what traffic is passing by on the network. While it produces a ton of useful data, sometimes it can be challenging to parse out exactly what you are looking for. As an example, what if you want to check your network for sessions that stay active for long periods of time? This could be an indication of command and control activity. It could even be internal users circumventing Internet policies by tunneling to an outside proxy. In this blog post I’ll show you some easy ways to identify persistent connections with Bro/Zeek.
Conn.log Is Your Friend
Zeek’s connection log provides a wealth of information on each connection that gets captured. The first few lines of each connection log shows the labels for each column.
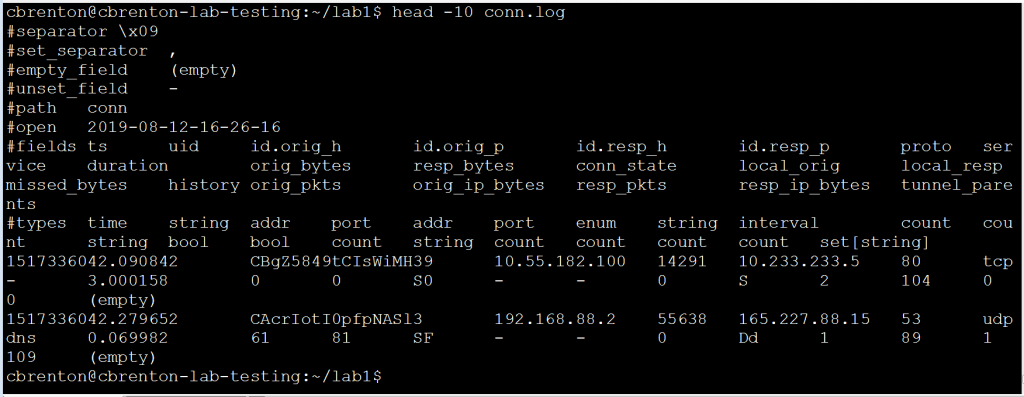
You can find a description of all of the fields that get reported here. For the purposes of this blog entry, we are going to focus in on three specific fields:
- id.orig_h = Source IP address
- id.resp_h = Destination IP address
- duration = Elapsed time between the first and last packet in a session
The goal is to identify which of our internal systems are communicating the longest. The “duration” field will help us identify these sessions. We will need to manipulate the output of conn.log. Because there is so much data, this can be a challenge to do directly. Luckily we can use bro-cut to identify only the specific fields we wish to work with.
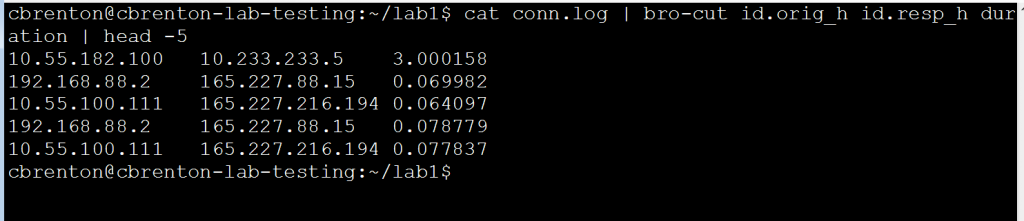
Notice that bro-cut returns just the three fields we are interested in seeing.
Finding the Longest Connections
The output of the above bro-cut command is almost exactly what we need. What is missing is some sorting. It would be nice to have the longest connections at the top so we could focus right in on them. Luckily we can leverage the “sort” command to complete this task. Here’s an example:
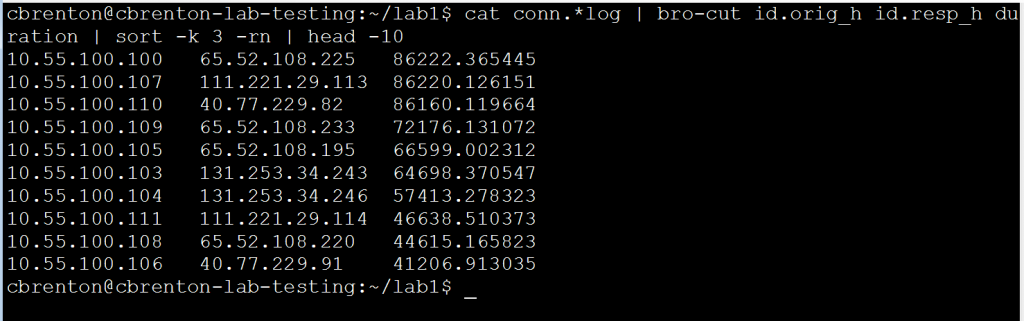
The “-k 3” switch tells “sort” to organize the output based on the value in the third column, rather than the first. The “-r” means to sort in reverse order (largest to smallest) and “-n” tells “sort” that the contents of the column is numeric values. Note that the output displays the top 10 longest connections for the time period being monitored. For reference, 86,400 seconds is one full day.
But Wait, There’s More!
The above output is great for showing the longest unique sessions, but what if multiple connections are made? For example, what if I have a Remote Access Trojan (RAT) that holds the connection open for only an hour, kills the session, and then opens a new one. Consider the following graphic:
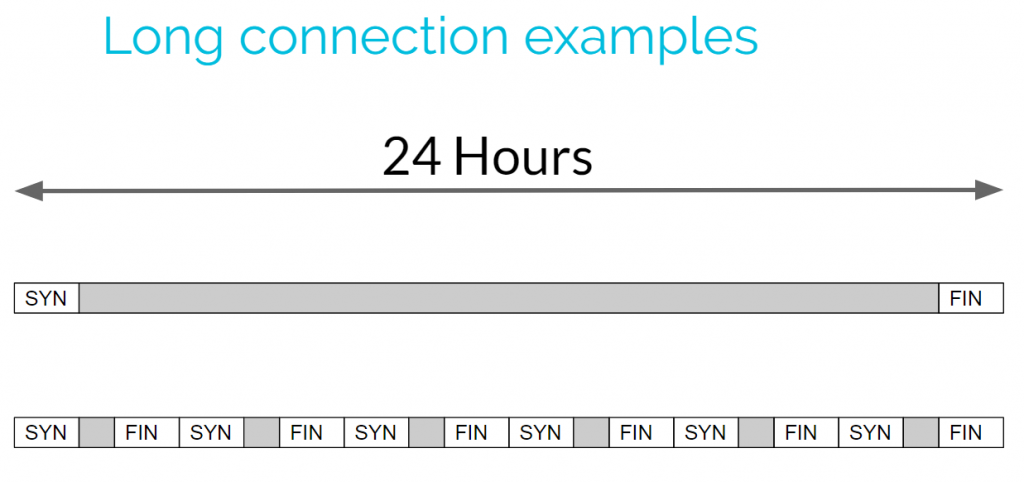
The top connection holds open the connection for 24-hours straight. This connection would easily jump to the top of the list in our example above. However, the connection on the bottom is made up of multiple shorter sessions. Since none of them are very long, this data may get lost in the output, even though the total connection time is the same as the first connection. So to find these we need a way to add up all of the connection times between IP address pairs.
Identifying Cumulative Connection Time
The “datamash” tool can be used to add up all of the connection times between IP address pairs. While this tool is usually not installed on Linux by default, you can download it using your favorite package management tool. This will allow you to review cumulative connection time. Have a look at the following figure:
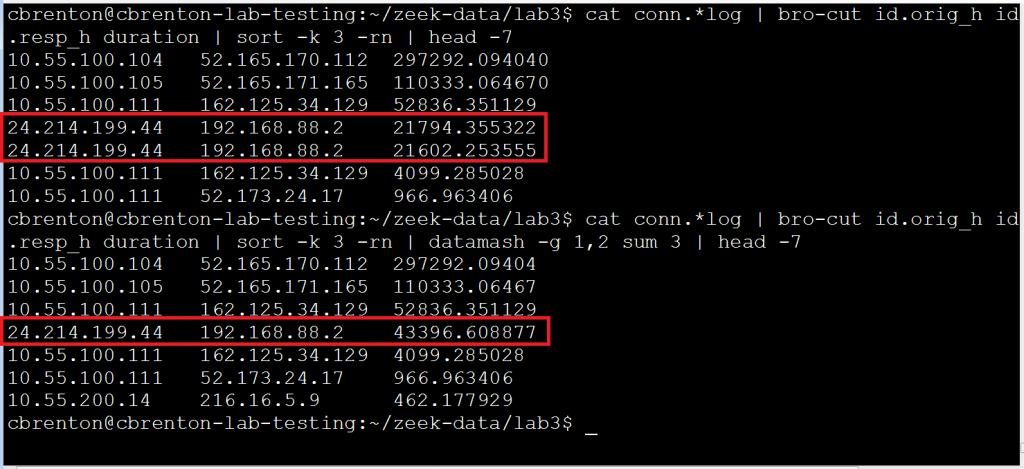
Note that in the first command I’m again using bro-cut to extract the fields of interest and then using sort to organize the connections based on length of time. Note that the fourth and fifth entry are between the same two IP addresses. If I want to know the total cumulative time two IP addresses are exchanging information, I need to add these values together. I’ve accomplished this using “datamash” in the second line of output.
The datamash “-g 1,2” switch tells the tool that I’ll want to perform a math function on all lines where column one (source IP) and column two (destination IP) are the same. The “sum” switch identifies that I want to add all of these values together. The value of “3” after “sum” identifies where the values are located that I want to add together. So to put this another way, we are telling datamash “for all instances where the value in column one and two are the same, add together the values in column three”. Note that lines four and five are now combined together into a single entry.
Lessons Learned
Connects that stay open for extended periods of time can be interesting from a security perspective. They may be an indication of command and control activity, or of savvy employees circumventing Internet usage policies. By combining Bro/Zeek with a bit of text manipulation, it’s easy to generate a daily report that will quickly flag these suspect connections.

Chris has been a leader in the IT and security industry for over 20 years. He’s a published author of multiple security books and the primary author of the Cloud Security Alliance’s online training material. As a Fellow Instructor, Chris developed and delivered multiple courses for the SANS Institute. As an alumni of Y-Combinator, Chris has assisted multiple startups, helping them to improve their product security through continuous development and identifying their product market fit.